Category Archives: Brocade

Brocade supportsave via BNA or DCFM

If you work with Brocade gear you might have come across their management tool called Brocade Network Advisor. A very nifty piece of software which lets you do almost 99% of all things you want to do with your fabrics whether is FOS or NOS based.

When you work in support you often need logs and the Brocade switches provide these in two flavours: the useful and useless. (ie supportsave vs supportshow respectively)

If you need a reference of your configuration and want to do some checking on logs and configuration settings a supportSHOW is useful for you. When you work in support you most often need to dig a fair bit deeper and thats where the supportSAVE comes into play. Basically it’s a collection method of the entire status of the box including ASIC and linux panic dumps, stack-traces etc. This process runs on the CP itself so its not a screengrab of tekst as you can imagine.

Normally when you collect these you’ll log into the switch and type “supportsave”, fill in the blanks and some directory on your ftp or ssh system fills up with these files which you then zip up and send to your vendor.

If you have a large fabric please make sure you collect these files per switch in a subfolder and upload these seperatly !!!!!

If you are in the luck position you have BNA you also can collect these via this interface. The BNA process will create the subfolders for you and zip these up for later.

When you look in the zip-file you’ll see that  all filenames have the following structure:

“Supportinfo-date-time\switcname-IPaddress-switchWWN\

Obviously if you work on a Windows box to extract all this Windows will create all subfolders for you. Given the fact I do my work on a Linux box I get one large dump of files with the same file-names as depicted above without the directory structure so every files from every switch is still located in the same folder. This is due to the fact Linux (or  POSIX in general) allows the “\” as a valid character in the file name and the “/” is used for folder separation. 🙁

I used to come across this every so now and then and it didn’t anoy me to such an extent to fix it but lately the use of this collection method (BNA style)  seems to increase so i needed something simple to fix it.

Since Linux can do almost everything i wrote this little oneliner to create a subfolder per switch and move all files belonging to that switch into that folder:

1. #!/bin/bash
2. pushd $@
3. for i in `ls`;do x=$(echo $i | awk -F\\ ‘{print $3 }’);y=$(echo $i | awk -F\\ ‘{print $2 }’); mkdir -p $y; mv $i $y/$x; done
4. popd

Link this to a Nautilus-script softlink and a right click in the Nautilus file manager will do the trick for me.

Voila, lots of time saved. Hope it helps somebody.

Cheers,
Erwin

The first law of the Time Lords | Aussie Storage Blog

A buddy of mine posted this article and it reminded me of the presentation I did for the Melbourne VMUG back in April of this year.

The first law of the Time Lords | Aussie Storage Blog:

If you have ever worked in support (or had the need to check on events in general as an administrator) you know how important it is to have an accurate timestamp. Incorrect clock settings are a nightmare if you want to correlate event that are logged on different times and dates.

When you look at the hyper scale of virtualised environments you will see that the vertical stack of IO options is almost 10 fold. Lets have a look from top to bottom where you can set the clock.

  1. Application
  2. VM, the virtual machine
  3. Hypervisor
  4. network switches
  5. The 1st tier storage platform (NAS/iSCSI)
  6. A set of FC switches
  7. The second tier storage platform
  8. Another set of FC switches
  9. The virtualised storage array
Which in the end might look a bit like this. (Pardon my drawing skills)
As you can imagine it’s hard enough to start figuring out where an error has occurred but when all of these stacks have different time settings it’s virtually impossible to dissect the initial cause.
So what do you set on each of these? That brings us to the question of “What is time”. A while ago I watched a video of a presentation by Jordan Sissel (who is working full-time on a open-source project called LogStash). One of his slides outlines the differences in timestamps.:
So besides the different time-formats you encounter in the different layers of the infrastructure imagine what it is like to first get all these back into a human readable format and then aligned across the entire stack. 
While we’re not always in a position to modify the time/date format we can make sure that at least the time setting is correct. In order to do that make sure you use NTP and also set the correct timezone. This way the clocks in the different layers of the stack across the entire infrastructure say aligned and correct. 
You will help yourself and your support organisation a great deal.
Thanks,
Erwin van Londen

Brocade FOS 7.1 and the cool features

After a very busy couple of weeks I’ve spent some time to dissect the release notes of Brocade FOS 7.1 and I must say there are some really nice features in there but also some that I REALLY think should be removed right away.

It may come to no surprise that I always look very critical to whatever come to the table from Brocade, Cisco and others w.r.t. storage networking. Especially the troubleshooting side and therefore the RAS capabilities of the hardware and software have a special place in my heart so if somebody screws up I’ll let them know via this platform. 🙂
So first of all some generics. FOS 7 is supported on the 8 and 16G platforms which cover the Goldeneye2,Condor2 and Condor 3 ASICs plus the AP blades for encryption, SAN extension and FCoE. (cough, cough)….Be aware that it doesn’t support the blades based on the older architecture such as the FR4-18i and FC10-6 (which I think was never bought by anyone.)  Most importantly this is the first version to support the new 6520 switch so if you ever think of buying one it will come shipped with this version installed. 
Software
As for the software features Brocade really cranked up the RAS features. I especially do like the broadening of the scope for D-ports (diagnostics port) to include ICL ports but also between Brocade HBA’s and switch ports. One thing they should be paying attention to though is that they should sell a lot more of these. :-). Also the characteristics of the test patterns such as test duration, frame-sizes and number of frames can now be specified. Also FEC (Forward Error Correction) has been extended to access gateways and long distance ports which should increase stability w.r.t. frame flow. (It still doesn’t improve on signal levels but that is a hardware problem which cannot be fixed by software).
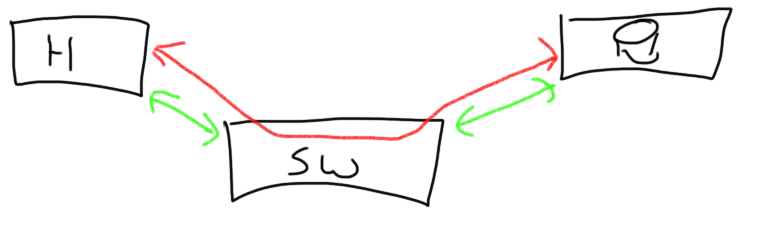
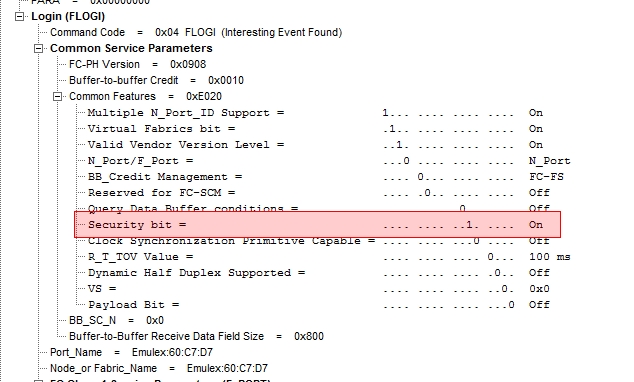
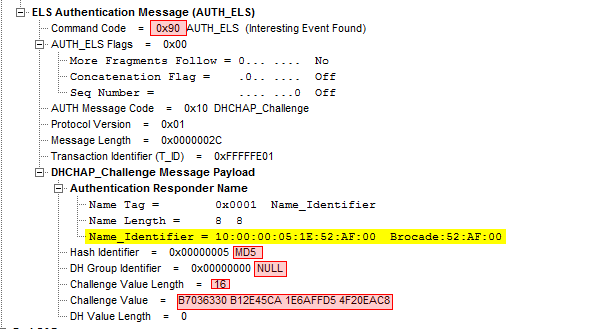
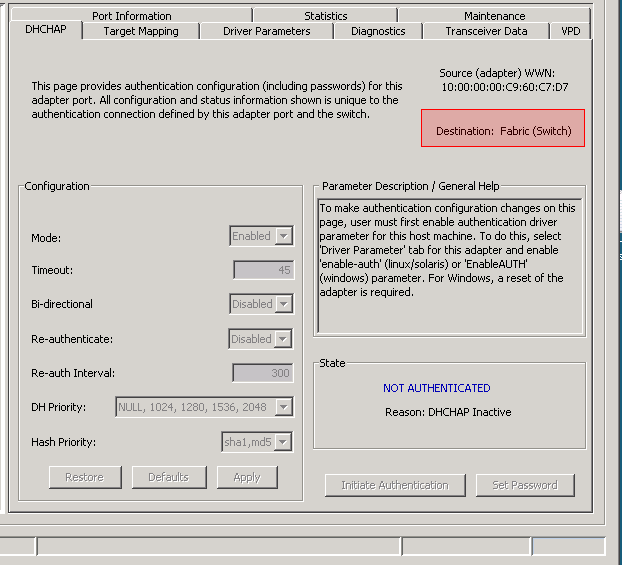
There are some security enhancements for authentication such as extended LDAP and TACACS+ support.
The 7800 can now be used with VF albeit not having XISL functionality. 
Finally the E_D_TOV FC timer value is propagated onto the FCIP complex. What this basically means that previously even though an FC frame had long timed-out according to FC specs (in general 2 seconds) it could still exist on the IP network in a FCIP packet. The remote FC side would discard that frame anyway thus wasting valuable resources. With FOS 7.1 the FCIP complex on the sending side will discard the frame after E_D_TOV has expired.
One of the most underutilised features (besides Fabric Watch) is FDMI (Fabric Device Management Interface). This is a separate FC service (part of the new FC-GS-6 standard) which can hold a huge treasure box of info w.r.t. connected devices. As an example:
FDMI entru
————————————————-
        switch:admin> fdmishow
        Local HBA database contains:
          10:00:8c:7c:ff:01:eb:00
          Ports: 1
            10:00:8c:7c:ff:01:eb:00
              Port attributes:
                FC4 Types: 0x0000010000000000000000000000000000000000000000000000000000000000
                Supported Speed: 0x0000003a
                Port Speed: 0x00000020
                Frame Size: 0x00000840
                Device Name: bfa
                Host Name: X3650050014
                Node Name: 20:00:8c:7c:ff:01:eb:00
                Port Name: 10:00:8c:7c:ff:01:eb:00
                Port Type: 0x0
                Port Symb Name: port2
                Class of Service: 0x08000000
                Fabric Name: 10:00:00:05:1e:e5:e8:00
                FC4 Active Type: 0x0000010000000000000000000000000000000000000000000000000000000000
                Port State: 0x00000005
                Discovered Ports: 0x00000002
                Port Identifier: 0x00030200
          HBA attributes:
            Node Name: 20:00:8c:7c:ff:01:eb:00
            Manufacturer: Brocade
            Serial Number: BUK0406G041
            Model: Brocade-1860-2p
            Model Description: Brocade-1860-2p
            Hardware Version: Rev-A
            Driver Version: 3.2.0.0705
            Option ROM Version: 3.2.0.0_alpha_bld02_20120831_0705
            Firmware Version: 3.2.0.0_alpha_bld02_20120831_0705
            OS Name and Version: Windows Server 2008 R2 Standard | N/A
            Max CT Payload Length: 0x00000840
            Symbolic Name: Brocade-1860-2p | 3.2.0.0705 | X3650050014 |
            Number of Ports: 2
            Fabric Name: 10:00:00:05:1e:e5:e8:00
            Bios Version: 3.2.0.0_alpha_bld02_20120831_0705
            Bios State: TRUE
            Vendor Identifier: BROCADE
            Vendor Info: 0x31000000
———————————————-
and as you can see this shows a lot more than the fairly basic nameserver entries:
——————————————-
N    8f9200;      3;21:00:00:1b:32:1f:c8:3d;20:00:00:1b:32:1f:c8:3d; na
    FC4s: FCP 
    NodeSymb: [41] “QLA2462 FW:v4.04.09 DVR:v8.02.01-k1-vmw38”
    Fabric Port Name: 20:92:00:05:1e:52:af:00 
    Permanent Port Name: 21:00:00:1b:32:1f:c8:3d
    Port Index: 146
    Share Area: No
    Device Shared in Other AD: No
    Redirect: No 
    Partial: No
    LSAN: No
——————————————
Obviously the end-device needs to support this and it has to be enabled. (PLEASE DO !!!!!!!!) It’s invaluable for troubleshooters like me….
One thing that has bitten me a few times was the SFP problem. There has long been a problem that when a port was disabled and a new SFP was plugged in the switch didn’t detect that until the port was enabled and it had polled for up-to-date information. In the mean time you could get old/cached info of the old SFP including temperatures, db values, current, voltage etc.. This seems to be fixed now so thats one less thing to take into account.
Some CLI improvements have been made on various commands with some new parameters which lets you filter and select for certain errors etc.
The biggest idiocracy that has been made with this version is to allow the administrator change the severity level of event-codes. This means that if you have a filter in BNA (or whatever management software you have) to exclude INFO level messages but certain ERROR or CRITICAL messages start to annoy you you could change the severity to INFO and thus they don’t show up anymore. This doesn’t mean th problem is less critical so instead of just fixing the issue we now just pretend it’s not there. From a troubleshooting perspective this is disastrous since we look at a fair chuck of sup-saves each day and if we can’t rely on consistency in a log file it’s useless to have a look in the first place. Another one of those is the difference in deskew values on trunks when FEC is enabled. Due to a coding problem these values can differ up to 40 therefore normally depicting a massive difference in cable length. Only by executing a d-port analysis you can determine if that is really the case or not. My take is that they should fix the coding problem ASAP.  
A similar thing that has pissed me off was the change in sfpshow output. Since the invention of the wheel this has been the worst output in the brocade logs so many people have scripted their ass off to make it more readable.
Normally it looks like this:
=============
Slot  1/Port  0:
=============
Identifier:  3    SFP
Connector:   7    LC
Transceiver: 540c404000000000 2,4,8_Gbps M5,M6 sw Short_dist
Encoding:    1    8B10B
Baud Rate:   85   (units 100 megabaud)
Length 9u:   0    (units km)
Length 9u:   0    (units 100 meters)
Length 50u:  5    (units 10 meters)
Length 62.5u:2    (units 10 meters)
Length Cu:   0    (units 1 meter)
Vendor Name: BROCADE         
Vendor OUI:  00:05:1e
Vendor PN:   57-1000012-01   
Vendor Rev:  A   
Wavelength:  850  (units nm)
Options:     003a Loss_of_Sig,Tx_Fault,Tx_Disable
BR Max:      0   
BR Min:      0   
Serial No:   UAF11051000039A 
Date Code:   101212  
DD Type:     0x68
Enh Options: 0xfa
Status/Ctrl: 0xb0
Alarm flags[0,1] = 0x0, 0x0
Warn Flags[0,1] = 0x0, 0x0
                                          Alarm                  Warn
                                   low        high       low         high
Temperature: 31      Centigrade    -10         90         -5          85
Current:     6.616   mAmps          1.000      17.000     2.000       14.000 
Voltage:     3273.4  mVolts         2900.0      3700.0    3000.0       3600.0 
RX Power:    -2.8    dBm (530.6uW) 10.0   uW 1258.9 uW   15.8   uW  1000.0 uW
TX Power:    -3.3    dBm (465.9 uW)125.9  uW   631.0  uW  158.5  uW   562.3  uW
and that is for every port which basically makes you nuts.
So with some bash,awk,sed magic I scripted the output to look like this:
Port  Speed   Long  Short  Vendor     Serial            Wave   Temp   Current  Voltage   RX-Pwr   TX-Pwr
wave wave number Length
1/0 8G NA 50 m BROCADE UAF11051000039A 850 31 6.616 3273.4 -2.8 -3.3
1/1 8G NA 50 m BROCADE UAF110510000387 850 32 7.760 3268.8 -3.6 -3.3
1/2 8G NA 50 m BROCADE UAF1105100003A3 850 30 7.450 3270.7 -3.3 -3.3
etc....
From a troubleshooting perspective this is so much easier since you can spot issues right away.
Now with FOS 7.1.x the FOS engineers screwed up the SFPshow output which inherently screwed up my script which necessitates a load more work/code/lines to get this back into shape. The same thing goes for the output on the number of credits on virtual channels.
Pre-FOS 7.1 it looks like this:
C:—— blade port 64: E_port ——————————————
C:0xca682400: bbc_trc                 0004 0000 002a 0000 0000 0000 0001 0001 
With FOS 7.1 it looks like this:
bbc registers
=============
0xd0982800: bbc_trc                 20   0    0    0    0    0    0    0    
(Yes, hair pulling stuff, aaarrrcchhhh)
Some more good things. The fabriclog now contains the direction of link resets. Previously we could only see an LR had occurred but we didn’t see who initiated it. Now we can and have the option to figure out in which direction credit issues might have been happening. (phew..)
The CLI history is now also saved after reboots and firmware-upgrades. Its been always a PITA to figure out who had done what at a certain point-in-time. This should help to try and find out.
One other very useful thing that has been added and it a major plus in this release is the addition of the remote WWNN of a switch in the switchshow and islshow output even when the ISL has segmented for whatever reason. This is massively helpful because normally you didn’t have a clue what was connected so you also needed to go through quite some hassle and check cabling or start digging through the portlogdump with some debug flags enabled. Always a troublesome exercise. 
The bonus points from for this release is the addition of the fabretrystats command. This gives us troubleshooters a great overview of statistics of fabric events and commands. 
SW_ILS
————————————————————————————————————–
E/D_Port ELP  EFP  HA_EFP DIA  RDI  BF   FWD  EMT  ETP  RAID GAID ELP_TMR  GRE  ECP  ESC  EFMD ESA  DIAG_CMD 
————————————————————————————————————–
0        0    0    0      0    0    0    0    0    0    0    0    0        0    0    0    0    0    0        
69       0    0    0      0    0    0    0    0    0    0    0    0        0    0    0    0    0    0        
71       0    0    0      0    0    0    0    0    0    0    0    0        0    0    0    0    0    0        
79       0    0    0      0    0    0    0    0    0    0    0    0        0    0    0    0    0    0        
131      0    0    0      0    0    0    0    0    0    0    0    0        0    0    0    0    0    0        
140      0    0    0      0    0    0    0    0    0    0    0    0        0    0    0    0    0    0        
141      0    0    0      0    0    0    0    0    0    0    0    0        0    0    0    0    0    0        
148      0    0    0      0    0    0    0    0    0    0    0    0        0    0    0    0    0    0        
149      0    0    0      0    0    0    0    0    0    0    0    0        0    0    0    0    0    0        
168      0    0    0      0    0    0    0    0    0    0    0    0        0    0    0    0    0    0        
169      0    0    0      0    0    0    0    0    0    0    0    0        0    0    0    0    0    0        
174      0    0    0      0    0    0    0    0    0    0    0    0        0    0    0    0    0    0        
175      0    0    0      0    0    0    0    0    0    0    0    0        0    0    0    0    0    0        
This release also fixes a gazillion defects so its highly advisable to get to this level better sooner than later. Check with your vendor for the latest supported release.
So all in all good stuff but some things should be reverted, NOW!!!. and PLEASE BROCADE: don’t screw up more output in such a way it breaks existing analysis scripts etc…
Cheers
Erwin

Brocade and the "Woodstock Generation"

I encourage change especially if there are technological advances that improves functionality, reliability, availability and serviceability (or RAS in short). What I hate if these changes increase risk and require a fair chuck of organisational change even more if they amplify each other (like FCoE).

What I hate even more though is for marketing people to take ownership of an industry standard and try to re-brand it for their own purposes and this is why I’m absolutely flabbergasted about Brocades press-release in which they announce a “new” generation of the fibre-channel protocol.

When the 60’s arrived a whole new concept of how people viewed the world and the way of living changed. Freedom became a concept by which people lived and they moved away from the way their ancestors did in previous decades. They’d shed the straitjacket of the early 20th century and changed the world through various parts of life. This didn’t mean they discredited their parents or grandparents or even the generations before, neither did they perceive to be better or different in a sense they wanted to “re-brand” themselves. They didn’t need differentiation by branding, they did it by way of living.

Fibre-Channel has always been an open standard developed by many companies in the storage industry and I’ll be the last to deny that Brocade has contributed (and still does) a fair chunk of effort into the protocol. This doesn’t mean that they “own” the protocol nor does it give them the right to do anything with it as they please. It’s like claiming ownership of print when you’ve written a book.

So lets go back to their press release. In that they announced the following:

Brocade Advances Fibre Channel Innovation With New Fabric Vision Technology


Also Expands Gen 5 Fibre Channel Portfolio With Industry’s Highest-Density Fixed Port SAN Switch and Enhanced Management Software; Announces Plans for Gen 6 Fibre Channel Technology Supporting the Next-Generation Standard

and a little further-up:

Brocade Fabric Vision technology includes:

  • Policy-based tools that simplify fabric-wide threshold configuration and monitoring
  • Management tools that allow administrators to identify, monitor and analyze specific application data flows, without the need for expensive, disruptive, third-party tools
  • Monitoring tools that detect network congestion and latency in the fabric, providing visualization of bottlenecks and identifying exactly which devices and hosts are impacted
  • Customizable health and performance dashboard views, providing all critical information in one screen
  • Cable and optic diagnostic features that simplify the deployment and support of large fabrics

When I read the first line I thought that a massive stack of brocade engineers had come out of a dungeon and completely overhauled the FC protocol stack but I couldn’t be further from the truth. It were not the engineering people who came out of the dungeon but more the marketing people and they can up with very confusing terms like Gen5 and Gen6 which only represent the differences in speed technologies. Where the entire industry is used to 1G,2G,4G,8G and now 16G plus 32G, Brocade starts to re-brand these as GenX. So in a couple of years time you’ll need a cross-reference spreadsheet to map the speed to the GenX marketing terms.

As for the content of the “Fabric Vision technology” I must say that the majority of component were already available for quite a while. The only thing that is actually new is the ability to map policies onto fabrics via BNA to be able to check quickly for different kind of issues and setting which is indeed a very welcome feature but I wouldn’t call this rocket-science. You take a set of configuration options and you distribute this across one or more switches in a fabric and you report if they comply to these policies. The second bullet-point seems to be targeted at Virtual Instruments. From what I know of VI Brocade is still a long way off to be able to displace their technology. Utilities like frame-monitoring do not compete with fc-analyser kind of equipment.

The software side of BNA and VI seems to be getting closer which I do welcome. BNA is getting better and better with each release and closing the gap to tools which provide a different view of problems will certainly be useful. It also prevents the need for polling fabric-entities for the same info.

Bullet point  3 and 5 piggy back on already available features in FOS but now can be utilised to capture these in a dashboard kind of way via BNA. Bottleneck monitoring commands in addition to credit-recovery features plus D-port diagnostics to check on the health of links were already available. The BNA dashboard also provides a nifty snapshot of most utilised ports, port-errors, cpu and memory status of switches etc. This, in theory, should make my life easier but we’ll wait and see.

Don’t get me wrong, I do like Brocade. I’ve worked with their technologies since 1997 so I think I have a fairly good view of what they provide. They provide around 50% of my bread-and-butter these days (not sure if that’s a good thing to say though if you check out my job-title. :-)) but I cannot give them credit for announcing a speed-bump as a new generation of Fibre-Channel nor can I think of any reason of defining a “Vision” around features, functions and options that have been lacking for a while in their product set. I do applaud them for having it fixed though.

From my personal point of view what would be compulsory is to overhaul the FOS CLI. You can argue to take a consistent approach of using the “Cisco” like tree structure which Brocade also uses in their NOS on VDX switches but that doesn’t work for me either. Moving up and down menu trees to configure individual parts of the configuration is cumbersome. What needs to be done is to painstakingly hold on to consistent command naming and command parameters. This, in addition to the nightmare of inconsistent log-output across different FOS version,  is one of the worst parts of FOS and this should be fixed ASAP.

Cheers,
Erwin

A less known "host-can’t-see-storage" problem caused by FC-SP authentication failures.

Many support-cases open with the line “Host can’t see storage” which puts most of these cases in the “configuration” queue. My assumption is that if a host can’t “see” storage it has never worked before so there must be some kind of config problem.

So once in a while you’ll see a case popping up where a less used feature of the FC protocol is used and that is FC Authentication (part of the FC-SP protocol.) This piece of the FC stack allows for an authentication mechanism between two ports on a link or an end-to-end connection.
The FC-SP protocol allows for a security check to be set up to prevent unauthorized access to fabric services. Basically it means if you don’t know my authentication method and access passwords I do not trust you and I will not allow you access to the fabric.
The fabric security architecture is build upon 5 components namely:
  • Authentication Infrastructure
  • Authentication
  • Security Associations
  • Cryptographic Integrity and Confidentiality
  • and last but not least Authorization
I will not dive into each and every one of them since thats beyond the scope of this post. The Authentication part is fairly wide adopted by all HBA and switch vendors whilst the authorization and crypto services are only seen in very security environments.
Many initiators (mainly HBA’s) and targets (mainly storage devices) support the link authentication option but I haven’t come across an HBA vendor which also support the end-to-end authentication option.
The difference is depicted below.
The individual (green) N_port-to-N-port are obviously the ports participating in the individual link authentication whilst the end-to-end (red) ports have an end-to-end authentication configured (These are not mutually exclusive and can be configured individually (if supported of course))
“So what does this have to do with my host not seeing storage?” you might ask.
Well, very simple. If you have configured anything in this entire setup incorrectly each port may refuse access and therefore you will not see any targets or luns.
It’s fairly easy to make a mistake in this configuration so lets have a look on the wire to see what the switch and HBA do when this option is turned on.
As an example I use an Emulex HBA but the HBA’s from Qlogic, Brocade etc have a similar setup.
When an HBA tries to obtain access to a fabric it first sends out a FLOGI (Fabric login). In this FLOGI it tells the fabric it’s id (WWN),which capabilities it has and what services plus classes it wants to use.
On of the parameters of these services is the “Security services” which is identified by a single bit in the  “Common Services” parameter in this FLOGI.
The switch in turn checks for this bit and either returns with an ELS accept or, in case the authentication is not configured on the switch,  an LS reject.
In the picture below you see the accept. This doesn’t yet mean the ports have authenticated each other but merely have let each other know that they do want to start the authentication process.
Given the fact the FC-SP authentication infrastructure supports 3 methods of authentication (DH-CHAP, FCPAP and FCAP) we then need to establish the one we want to use. This is done with a ELS command coded 0x90
As you can see the HBA only can use 1 protocol and it wants to authenticate via DH-CHAP, it can use MD5 and SHA1 for hash marks and it can use 5 DH groups.
The accept from the switch is pretty straightforward:
As of this point the stage is set for the actual authentication. The ports have shown the do support the FC-SP protocol, they have set the DC-DHAP parameters which they are going to use so now they only thing that’s left is the actual exchange of shared secrets.
One of the interesting things is that as of this point the class of service changes to Class 2. As you can see in the trace the “Start-of-Frame” now initiates a class 2 exchange.
Given the fact class 2 means that we now require acknowledgement of frames we also see ACK_1 being returned for each frame being sent. Here the ACK_1 (C0) is sent from the switch to the HBA for sequence id 0x-08 of exchange id 0x50BD:
The DH-Challenge frame is then sent with the options the switch wants to use:
The command code is 0x90, with a 0x10 AUTH message code meaning I want to use DH-CHAP. The DHCHAP payload contains the parameters used in the challenge basically meaning I am WWN 10:00:00:00:05:1E:52:AF:00 , I use the MD5 hash in DH-group NULL and a value length of 16 bytes containing the following value.
This is still a Class-2 frame so an ACK_1 for acknowledgement is sent back prior to either an ELS Accept or reject.
If the HBA determines that these parameters are correct it will send an Accept back.
We are now at a point where the HBA trusts the switch but the switch has no clue he authenticated against the correct HBA so a DHCHAP reply from the HBA to the switch also has to be sent.
(What I did forget to highlight is that from a switch perspective it is the F-Port controller with Well-Known-Address 0xfffffe that takes care of the authentication and not the F-port itself. Just an FYI)
If the switch now determines these parameters are also correct an Accept is sent back and we have an authenticated session between these two ports.
The switch now sends a DHCHAP Success frame back which confirms the authentication status which is then acknowledge back by the HBA after which the rest of the usual FC handshaking takes place. (PLOGI,PRLI etc…)
The support problem.
Now the problem is that when we from support run into a “Host-cannot-see Storage” situation and the usual suspects like zoning, lun-masking have been excluded it will become very hard to check on situation like these since. Especially from a Brocade perspective it doesn’t provide much info besides the error messages which are not very useful beyond the fact it tells you that this error occurs and when it happens.
The second problem is that if this authentication is not used on the HBA nor the switch  but the target requires this then there is no indication at all.
As an example the Hitachi arrays do support both link-level as well as end-to-end authentication.
The first one is set on the individual physical ports and the second one on the Host-Storage domains in the Authentication utility via Storage-Navigator. If you have an HBA with drivers which support this end-to-end authentication you can set this up but if these HBA drivers do not support this the security bit in the PLOGI (which is used to login to the array) is set to 0 the array will just ignore this frame and send a reject back.
From a troubleshooting perspective it is fairly hard to diagnose that because the switch logs do not show initiator to target frames. We would need to set up separate frame monitors and/or enable debug flags This is a rather cumbersome way of doing thing so my suggestion is to check if both link-level and end-to-end authentication is supported and if these are properly configured.
As a tip on Emulex you can check in OC Manager if your HBA and driver supports this. If you can switch between “Destination: Fabric (Switch)” and “Destination: Target” the driver does supports end-to-end. If not then only link level authentication is supported.
The option to enable FC-Authentication (and hence turn on the bit 21 in the common services parameter in the FLOGI) is in the “Driver Parameters” tab:
The HBA needs to be reset after configuring DH-CHAP to trigger a new FLOGI.
To all HBA/CNA/Switch/Array/Tape/(and anything else you can connect to a FC port) firmware engineers I would like to ask to provide simple on/off flags/commands on ports to either enable/disable full frame capture. The first word of a payload is obviously not sufficient to troubleshoot these kind of issues.
Hope this is of any help.
Cheers,
Erwin van Londen

The Emergency Health Threat (EHT) on Brocade FC fabrics

Since a couple of FOS versions ago Brocade wanted to fix the problem Fibre-Channel has by definition called credit back-pressure. The word “problem” overstated since in 99.99999% of all fabrics you’ll never see this anyway.  As you know Fibre-Channel is a deterministic architected type of network which requires devices to behave properly. The chaos theory of Ethernet networks where flooding and broadcasts are more along the line of shoot the fly with a cannon doesn’t apply to Fibre-Channel.

So what is the issue then? By design two link-end points tell each other how many buffers they have available to store a FC frame during link initialization in the FLOGI (Fabric Login) phase. These is bi-directional so one side of the link can have 40 credits whilst the other only has three. This way the sending side know that it can send X amount of frames before it has to stop.

Below you see a snippet of a FC FLOGI trace plus the subsequent Accept.

The HBA tells the switch it has 3 buffers available so the switch is allowed to send a maximum of 3 frames before it need to wait for an R_RDY

 The switch then returns with an accept in which it tells the HBA that it has 8 buffers available.

When the sending side transmits a frame it subtracts one credit from this amount. The receiving side on the other side of the link forwards the frame to its destination and sends a, so called, R_RDY (Receiver Ready) primitive back to the transmitting side which causes the number of outstanding credits to be increased by one again. So far pretty simple but imagine the following scenario.

I have three servers on the left and a storage array on the right with a switch in the middle. You see that the link between the storage array and the switch carries all traffic from all three servers. In a normal situation this is no problem as long as all devices behave as they should. Send a frame as long as a credit is available and wait for an R_RDY to return to replenish that credit. Now what happens if the blue server start behaving badly? ie. for some reason either it is starting to become very slow on returning these R_RDY primitives or the R_RDY is corrupted due to a physical link problem. The second scenario is pretty easy to figure out since the switch logs these kind of problems in the porterrshow plus this particular link will log a lot of LR entries in the fabriclog. (Have a look)

To get back to the problem you’ll see that at some point in time when the number of credits are all used from port #6 to port #3 the frames that are coming in on the switch ingress port #7 can no longer be forwarded to that port 6 and subsequent port #3. So these buffers on port 7 will fill up pretty rapidly which also means there is no room anymore for frames arriving from the array destined to be forwarded via port #5 to the green server or port #4 to the red server.  So even when these two server have no problem at all they might get really impacted by the blue server. One way to overcome this is to shut down port #6 and you will see that traffic from the red and green server start flowing again. When there is a driver or firmware issue you will have some more troubles finding out what’s causing all this.

Now you may argue and say “listen dude, these frame do not sit in there indefinitely and at some point they will be discarded which allows for these buffer to be reused again so traffic starts flowing again.” Yes, you are right. There always has been a bit of a ballpark figure of a, so called, “hold time” which more or less meant that a frame may sit in an ingress buffer for X amount of time before the ASIC may discard that frame and free up the buffer and consequently return a R_RDY to the transmitting side. The issue is however that the transmitting port on the other side of the link might as well send a frame with the same troubled destination which also means that that frame will sit in the ingress buffer for that X amount of time. Brocade has used a formula to determine this “hold time” and on a default configured fabric this turns out to be 500ms. So in the previous example it may well be that for sending only two frames you lose an entire second. That’s an eternity in Fibre-Channel and storage so every precaution needs to be taken to prevent this from happening. Your performance across the fabric with sink through the toilet.

Now lets take this previous example one step further.

A fairly regular small to medium size SAN in a core-edge design looks a bit like this.

You have your servers on the left, the colored boxes are edge switches and the central ones are the cores. Nothing really fancy fancy but you already can see that from a trafficflow perspective  it becomes pretty weird already since everything can go everywhere based on the source and destination routing paths that are set up during fabric build and FSPF routing calculations. Especially on the ISL’s between the two cores you see all traffic from all servers, disk arrays and tape drives. You can imagine that is things start to stack up somewhere you will end up in the same scenario are I described before but with this difference that all traffic on those core ISL’s can be affected. So even one device which sits behind the red switch and has a target on the purple switch may cause a problem to servers sitting behind the yellow switch going to a target behind the light blue switch. Similar the other way around since high latency devices or software issues might also be in the target devices.

So how do you overcome such a situation? Well, since we can’t predict failures to the exact minute we can try to circumvent one device clogging up traffic through the entire fabric. The best and only answer is something I described in my earlier blog posts (check the Rotten Apple series) to shut down the misbehaving port(s). My take is that if a port doesn’t work properly anyway plus it has a significant adverse effect on the rest of the entire fabric it is really a nobrainer to shut it down. Brocade FOS has pretty nifty tools like fabricwatch to get this sorted. It seems that from any logical, technical and reasonable standpoint this is the best option. Until politics get involved and from that point on all hell breaks loose. Every non-related, non-technical and non-reasonable argument is thrown back at you to prevent the automation of these great tools to shut down a misbehaving device. It’s like you know you’re being robbed and the police is ready to intervene and catch these criminals but some politician (or business owner in your case) doesn’t allow that so the robbers get away with the loot.

So the second best answer is that we need to drop frames on the edge switches sooner than on the cores. With the introduction of FOS 6.3.1b Brocade added a parameter which allowed you to adjust this edge hold time from around 100ms to the default 500ms. So this would in essence be a fairly average candidate to prevent these kind of credit back-pressure problems. The reasoning is that if the edge switch does not have any credits to forward a frame to the core-switch in a shorter period than the core-switch needs to forward it on its egress ports, there will be no overload on the core switch and thus no timing issues on that side. This allows the cores to keep moving traffic since those ingress ports will not be  subjected to credit starvation since the frames are already dropped in an earlier stage and the outstanding buffer will be replenished sooner. In the end the result is that non-related traffic therefore will not be affected. There is however one major “gotcha”. This is a global switch setting on condor 2 platforms (which needs to be set on the default switch) and is applied PER ASIC AS SOON AS AN F-Port IS FOUND ON THAT ASIC. This means that if you share F-Ports and E-ports on a single ASIC the EHT is also applied on those E-ports so all returning traffic sitting in that Edge switch ingress port is immediately affected. So it is NOT a good idea to mix E-ports and F-ports on the same ASIC. What also is not a good idea is to have this EHT set too low (or tinkered with at all) on ASICs where target ports are connected since the argument is that one single target port might have a significant amount of fan-in ratio of devices and thus is more susceptible to somewhat elongated response times anyway which might affect timeing issues .

Although the EHT in general seems a great idea it can have some ramifications because what will happen on a very busy fabric where the credit_zero counters are already ramping up with significant speed. Reducing the time on which a frame can be sitting in a buffer might already be a problem. If frames are dropped due to timeouts whilst being allowed to sit around for 500ms will certainly be dropped with a much higher rate if the hold time is reduced.

Now here is where Brocade is currently shooting itself in the foot.

In subsequent versions, especially in the 7.0.1 and 7.1.0 releases they adjusted the default values from 500 to 220MS. ………. (keep thinking………)

Also there is a difference between Condor3 platforms (16G) and Condor2 platforms (8G) on the virtual circuits that live on the ISL’s plus the fact this is now configurable per logical switch (Condor3 platforms that is). Great fun if you have a mixed 8G and 16G blades in your DCX8510

Done thinking????

In general what we see in support is that many edge switches are embedded switches in blade-chassis and these fairly often fall under the responsibility of the server administrators. Now, I don’t want to discredit these fine folks, but in general they do not often take a look at the FC switches in this chassis. The result is that these switches are very often running old code. Now what happens if the storage admin decides to upgrade the core-switches to FOS 7.1.0x.??? The EHT will drop right away to 220ms since that’s the new default on that FOS version. The edge switches still run old code which have a default of 500ms hold-time so in a blink of an eye you now have a reversed EHT fabric where the edge switches (including the ones which might have bad behaving devices attached) are doing their job of trying to send a frame during 500ms but these frames will most likely be delayed much longer on the core-switches due to fan-in ratio and credit back-pressure and thus will be discarded at a much higher rate here than on the edge. Given the fact the EHT does not discriminate between frame on source and destination, all these dropped frames are likely to be from many, many initiators and targets across the fabric. This will results in the upper-layer protocols (like SCSI) having to re-drive their IO’s in addition to the normal workload and thus the parabolic eclipse of misery rises exponentially.

So what is my advice.

  1. First, keep all codelevels as up-to-date as possible.
  2. Monitor for bad-behaving devices, use FabricWatch AND SHUT THESE DOWN with the portfencing feature!!!!!!!!!!!!!! Preventing problems is always better that having to react on it.
  3. Make sure that if you use the EHT you configure it correctly. There are currently too many flaws in this feature that I wouldn’t recommend changing it to another value than the one we have used for decades and that is 500ms. If you fabric is up for it than keep it consistent across all switches in the fabric.
  4. Use bottleneck monitoring and alerting to identify high latency devices. Check these devices for up-to-date firmware and drivers and check if any physical issue might be the cause of the problem. (especially check the enc_out column of the porterrshow output.)
  5. Also use bottleneck monitoring to recover lost credits. Use the “bottleneckmon –cfgcredittools -intport -recover onLrOnly” command to have FOS fix credit issues on back-end links.
From a design perspective we often see schema’s which resemble the picture I’ve drawn above. A core-edge design with servers on one side and target on the other. Personally i think this is the worst design you could think of since it is susceptible to all sorts of nasty thing of which physical issues are the most obvious and easy to fix. Latency and congestion are a very different ballgame so keeping initiators and target as close as possible to each other has always had my preference. Try to localize per port-group, then  ASIC, then blade, then switch and last per hop count. This will give you the best performing and most resilient fabric.

!!!!!!!!!!!   UPDATE April 3rd 2013  !!!!!!!!!!!!

I’ve got some feedback from Brocade based on some questions we had:

In case of existing Fabric where EHT is 500ms and you insert a brand new 8510 in the core, the 8510 is set to 220. What is Brocade’s recommendation?

  • Brocade’s recommendation is to change the EHT for the new 8510 in the core to 500ms
  • Once set to 500ms on the 8510, any firmware upgrades to the DCX or 8510 will retain the EHT settings of 500ms

Can you set EHT on condor3 by port? Where can we check this setting in Supportsave logs?

  • You can’t set EHT by port … it is still one setting for the switch, but that setting will only take effect on individual ports based on the ASIC and port type:
Condor-2
  • ASIC has only F-ports. The lower EHT value will be programmed onto all F-ports
  • ASIC has both E-ports and F-ports.  All ports will be programmed with 500ms
  • ASIC has only E-ports.  All ports will be programmed with 500ms

Condor-3

  • ASIC has only F-ports.  The lower EHT value will be programmed onto all F-ports
  • ASIC has both E-ports and F-ports.  The lower EHT value will be programmed onto all F-ports, and 500ms will be programmed onto all E-ports
  • ASIC has only E-ports. All ports will be programmed with 500ms
  • You can see the current value set by using the following CLI command:

configshow | grep “edge”
switch.edgeHoldTime:500

  • This should also be part of the system group, configShow command in the Supportsave

What is the real default for FOS 7.x  220 or 500?

  • Brand new system, newly installed with 7.X firmware:   Default will be 220
What is Brocade’s Best practice? 220 on edge and 500 in core?
  • Yes, from our testing, we have shown this to be the optimal setting.   

Additional info:

  • Existing DCX upgraded from 6.4.2 or 6.4.3 to 7.X:               Setting will remain at 500ms with one exception :

Upgrading from 6.4.2 or 6.4.3, the 6.x default of 500ms will be retained, with one exception: If the configure command had never been run before, and the very first time it is run is after upgraded to 7.X then the EHT will use the 7.x default of  220ms  (I don’t think this should be a concern because every end user would have run the configure command. I think this would only apply on a new unit shipped with 6.x, never installed/configured, then upgraded to 7.x, then configured. In this case it would appear as a “new” 7.x install with 7.x default).

=================================================================

As mentioned above there will be some separate documentation around this topic. My preference would be to have the ability to segregate core from edge-switches plus manually be able to differentiate between E- and F-ports irrespective of FOS version and/or chip type but I also do acknowledge this might not be a real option on older equipment.

Hope this helps a bit if you get confused by the different options and settings regarding this Edge-Hold-Time.

Regards,
Erwin

PS. The “hold-time” formula I mentioned above is  ((RA_TOV – ED_TOV)/(max_hops + 1))/2 which by default translates to (10000ms-2000ms)/(7+1)/2=500ms

and PPS: pardon my drawing skills. 🙂

The great misunderstanding of MPIO

Dual HBA’s, Dual Fabrics, redundant cache, RAID-ed disks, dual controllers or switched matrices, HA X-bars, multipath software installed and all OS drivers, firmware, microcode etc etc is up-to-date. In other words you’re all sorted and you can sleep well tonight.

And then Murphy strikes……..

As I’ve described in my previous articles it takes one single misbehaving device to really screw up a storage environment. Congestion and latency will, at some point in time, cause FC frames to go into the bit-bucket hence causing one or multiple IO errors. So what is exactly an IO error?

When an application want to read or write data it does this (in the open-systems world) via a SCSI command. (I’ll leave the device specific commands for later)
This command is than mapped at the FC4 layer into FC frames which then travel via the FC network to the target.

So lets take for example a database application that needs to read an piece of data. This is never done in chunks of a couple of bytes like single rows but it is always done with a certain size. This depends on the configuration of the application. For arguments sake lets assume the database uses 8KB IO sizes. So the read command is issued against a LUN on the SCSI layer more-or-less outlines the LUN id, the offset and the block-count from that offset. So for a single read-request an 8KB read is done on the array.  Since a fibre channel frame holds only 2 KB, this IO is split into 4 FC frames which are linked via, so called, sequence id’s. (I’ll spare you the entire handling on exchanges, sequences etc….). So if one of these frames are dropped somewhere under way we’re missing 2K out the total 8K. this means that for example frame 1, 2 and 4 have arrived back at the HBA but before the HBA can forward this to the SCSI layer is has to wait for frame 3 to arrive to be able to re-assemble the full IO. If frame 3 was dropped for whatever reason, the HBA has to wait for a pre-determined time before it will flag the IO as incomplete and will thus mark the entire FC exchange as invalid and will send and abort message with a certain status code to the SCSI layer. This will trigger the SCSI layer to retry the IO again and as such will consume the same resources on the system, FC fabric and storage array as the original request. You can imagine this can, and in many occasions will, cause performance issues or, in even more subsequent occurrences, an application failure.

Now when you look at the above traffic-flow all this time there has not been a single indication that the actual physical or logical path has disappeared between the HBA and the storage port. No HBA, storage or switch port has gone offline. The above was just the result of frames being dropped due to congestion, latency or any other reason. This will not trigger any MPIO software to logically remove a path and thus it will just keep on sending IO’s to the target over a path that may be somewhat erroneous. Again, it is NOT the purpose of MPIO to monitor and act up IO-errors.

If you are able to identify which path observes these errors you can disable this path from the MPIO software and you can fix the problem path at your earliest convenience. As I mentioned above this kind of behaviour very often occurs during Murphy time ie. during your least convenient time. This means that you will get called during your beauty sleep at 3:00AM  with a message that you’re entire ERP application is down and that 4 factories and 3 logistics distributions centre’s are picking their nose at $20,000 a minute.

So what happens when a real path problem is observed. Basically it means that a physical or logical issue occurred somewhere down the line. This can be a physical issue like a broken cable or SFP but also a bit- or word synchronisation issue between two ports in that path. This will trigger the switch to send a so called RSCN (Registered State Change Notification) to be sent to all ports in the same fabric and zone as the one that observed the problem. (Now, this also depends on the RSCN state registration of those devices but these are 99% of the time OK). This RSCN contains all 24-bit fabric addresses which are affected. (There can be more than one of course when ISL’s are involved.)

As soon as this RSCN arrives at the initiator the HBA will disassemble it and notify the upper layer of this change. This is done with different status codes as the IO errors as I described above. Based up the 24-bit fabric ID’s MPIO can then determine which path to that particular target and LUN was affected and as such can take it off-line. There can still be one or more IO errors as this depends on how many were in-flight during the error.

So what is the solution. As always the best way is to prevent this kind of troublesome scenario’s. Make sure you keep an eye on error counters and immediately fix these devices. If for some reason a device starts to behave this way during your beauty sleep, you need to make sure beforehand it will not further impact the rest of the environment. You can do this by disabling a ports either on the switch, HBA or storage port but that depends on where the problem is observed. Use tools that are build into the software like NX-OS or FOS to identify these troublesome links and disable them with features like portfencing. Although it might still have some impact this is nothing compared to a ongoing issue which might take hours or even days to identify.

As always use the manuals to determine how to set this up. If you’re inside the HDS network you can access a tool I wrote to very easily generate the portfencing configuration. Send me an email about this if you’re interested.

Hope this explains a bit the difference between IO errors and path problems w.r.t. MPIO and removes the confusion of what MPIO is intended to do.

Kind regards,
Erwin

P.S. for those unaware, MPIO (Multi Path IO) is software that maps multiple paths to target and LUNs to a single logical entity on a host so it can use all those paths to address that target/LUN. Software like Hitachi Dynamic Link Manager, EMC Powerpath, HP SecurePath and Veritas DMP fall into this category.

Brocade just got Bigger and Better

A couple of months ago Brocade invited me to come to San Jose for their “next-gen/new/great/ what-have-ya” big box. Unfortunately I had something else on the agenda (yes, my family still comes first) and I had to decline. (they didn’t want to shift the launch of the product because I couldn’t make it. Duhhhh.)

So what is new? Well, it’s not really a surprise that at some point in time they had to come out with a director class piece of iron to extend the VDX portfolio towards the high-end systems.  I’m not going to bore you with feeds and speeds and other spec-sheet material since you can download that from their web-site yourself.

What is interesting is that the VDX 8770 looks, smells and feels like a Fibre-Channel DCX8510-8 box. I still can’t prove physically but it seems that many restriction on the L2 side have a fair chunk of resemblance with the fibre-channel specs. As I mentioned in one of my previous posts, flat fabrics are not new to Brocade. They have been building this since the beginning of time in the Fibre-Channel era so they do have quite some experience in scalable flat networks and distribution models. One of the biggest benefits is that you can have multiple distributed locations and provide the same distributed network without having to worry about broadcast domains, Ethernet segments, spanning-tree configurations and other nasty legacy Ethernet problems.

Now I’m not tempted to go deep into the Ethernet and IP side of the fence. People like Ivan Pepelnjack and Greg Ferro are far better in this. (Check here and here )

With the launch of the VDX Brocade once again proves that when they set themselves to get stuff done they really come out with a bang. The specifications far outreach any competing product currently available in the market. Again they run on the bleeding edge of what the standards bodies like IEEE, IETF and INCITS have published lately. Not to mention that Brocade has contributed in that space makes them frontrunners once again.

So what are the draw-backs. As with all new products you can expect some issues. If I recall some high-end car manufacturer had to call-in an entire model world-wide to have something fixed in the brake-system so its not new or isolated to the IT space. Also with the introduction of the VDX an fair chuck of new functionality has gone into the software. It’s funny to see that something we’ve taken for granted in the FC space like layer 1 trunking is new in the networking space.

Nevertheless NOS 3.0 is likely to see some updates and patch releases in the near future. Although I don’t deny some significant Q&A has gone into this release its a fact that by having new equipment with new ASICS and functionality always brings some sort of headaches with them.

Interoperability is certified with the MLX series as well as the majority of the somewhat newer Fibre-Channel kit. Still bear in mind the require code levels since this is always a problem on supportcalls. 🙂

I can’t wait to get my hand on one of these systems and am eager to find out more. If I have I’let you know and do some more write-up here.

Till next time.

Cheers,
Erwin

DISCLAIMER : Brocade had no influence in my view depicted above.

One rotten apple spoils the bunch – 4

Credit – who doesn’t want to have lots of it at the bank

According to Wikipedia the short definition in finance terms is :

Credit is the trust which allows one party to provide resources to another party where that second party does not reimburse the first party immediately (thereby generating a debt, but instead arranges either to repay or return those resources (or other materials of equal value) at a later date


In Fibre Channel it’s not much different. During initialization of a port they both provide the remote party a certain amount of resources (buffer credits) which tell the remote party it is allowed to send this x amount of frames. If this credit is used up the sending port is no longer allowed to send anymore frames. The receiving port get the frame and when the first couple of bytes have been read it will send a so called R_RDY to the sending port telling him to increase his credit by one. This part I described before.

A short side note is that this is normal operation in a class 3 FC network. A class 1 network uses End-to-End credits but this is hardly ever used. 

Taking the above into account it shows that all links in a FC network use this method for flow control. This is thus not only restricted to HBA, Disk, Tape and switchports but also internally within switches this method is used. The most explanatory way of showing this is when you have a blade based chassis where ports in one blade need to transfer frame to a port on another blade. Basically this means that the frame will traverse two more hops before it reaches that port. If you have a small switch with only one ASIC all frames will be short routed in that same ASIC.

As an example.
A Brocade 5100 has a single 40-port Condor2 ASIC which means all 40 front-end ports are connected to this same chip.


Any frame traversing from port 1 to port 9 will be switched inside that same chip. Sounds obvious. This also means there are only two points of B2B flow control and that is between the devices connected to both port 1 and 9.

When looking at a Brocade 5300 there is completely different architecture.


This switch has 5 GoldenEye2 ASICS which serve 80 front-end ports (16 each) and 4 back-end ASIC which serve as interconnect between those 5 front-end ASICs. Each GoldenEye2 chips has 32 8G ports and each front-end to back-end link is connected with a single 4-port trunk which allows for any-to-any 1:1 subscription ratio.

If we look at this picture and have an HBA connected to port 1 and a storage device connected to port 45 you’ll see that the frame has to traverse 2 additional hops from ASIC 1 to a back-end ASIC and from there onward to ASIC 5. (Internal links are not counted as an official “hop-count” so it is not calculated on fabric parameters.) As you have seen in my previous post when a link error between an end-device and a switch port surfaces causing credit depletion the switch or device will reset the link, bring back the credit count to login values and the upper layer protocol (ie SCSI)  has to retry the IO. There is no such mechanism on back-end ports. You might argue that given the fact this is all inside the switch and no vulnerable components like optical cables can cause corrupt primitives hence lost R_RDY’s are impossible. Unfortunately this is not entirely true. There might be circumstances where front-end problems might propagate to the back-end. This is often seen during very high traffic times and problematic front-end ports. The result is that one or more of those back-end links have a credit stuck at zero which basically means the front-end port is no longer allowed to send frames to the back-end therefore causing similar problems with high latency and elongated IO recovery times. The REALLY bad news is that there is (now : “was”) no recovery possible besides bouncing the entire switch. (By bouncing I mean a reboot and not throwing it on the floor hoping it will return in your hands. Believe me, it wont. At least not in one piece)

All the Brocade OEM’s have run into situations like this with their customers and especially on larger fabrics with multiple blade based chassis with hundreds of ports connected you can imagine this was not a good position to be in.

In order to fix this Brocade has implemented some new logic, albeit proprietary and not FC-FS standard, which allows you to enable a feature to turn on back-end credit checking. In short what it does is that it monitors the number of credits on each of these back-end links, if the credit counter stays at less than the number of credits negotiated during login for the E_D_TOV timeframe and no frames has been sent during that timeframe, the credit recovery feature will reset the link for you in a similar fashion as the front-end port do, and it will resume normal operation.

The way turn on this feature is also part of the bottleneckmon command:

bottleneckmon –cfgcredittools -intport -recover onLrOnly

To be able to use this command you have to be at least at FOS level 6.3.2d, 6.4.2a or higher.
The latest FOS releases also have a manual check in case you might suspect a stuck credit condition.

As soon as you’ve enabled this feature (which I suggest you do immediately) you might run into some new errorcodes in the eventlog. When a lost credit condition is observed you will see a C2-1012 which shows something similar like this:

Message , [C2-1012], ,, WARNING, ,S,P(): Link Timeout on internal portftx= tov= (>)vc_no= crd(s)lost= complete_loss:.  (s)>

If this happens due to a problem on the back-end whereby a physical issue might be the problem the cause is most likely an increased bit error rate causing the same encoding/decoding errors. As shown before this will also corrupt R_RDY primitives. In addition to the C2-1012 you will also see a C2-1006 sometimes followed by a C2-1010

Message , [C2-1006], ,, WARNING, ,S,C: Internal link errors reported, no hardware faultsidentified, continuing monitoring: fault1:, fault2:thresh1:0x.  

Message , [C2-1010], ,, CRITICAL, ,S, C: Internal monitoring has identified suspecthardware, blade may need to be reset or replaced: fault1:,fault2: th2:0x.  

There are some more errorcodes which outline specific conditions but I refer to the Brocade Message Reference guide for more info.

We talked a bit of frameflow and latency in the previous articles. Besides corruption due to a high bit-error rate you might be running into a high latency device which basically is a device which is slow in returning credits. Sometimes this is by design as firmware engineers might use this as a way to throttle incoming traffic which they are unable to offload onto the PCI bus or there is some other problem inside the system itself which causes elongated handling of data by which the HBA cannot send the data quick enough to memory via RDMA or to the CPU for further handling.
Although it is a choice of the firmware and design engineers normally the response time to send back  buffercredits should be virtually instantaneous.

To to give you a feeling of the timing an average R_RDY reponse time is around 1 to 5us. If you have a older network with low performance links this might increase to around 50us or sometimes higher.

Sorry, here should be a picture of a FC trace snippet
FC trace

As you can see (i hope you have good eyesight) the R_RDY is returned within 2us of the dataframe being sent. This includes the reception of the first 24 bytes of the frame and the routing decision time-span the switchport has made. So all in all pretty quick.

On somewhat slower equipment it looks a bit like this:

(The time between the frame and R_RDY shows a delta of 10.5us)

When you have a latency problem where the device is realy slow in returning credits this time is far greater than shown above.

The above picture come from a pretty expensive FC analyser and I don’t expect you to buy one (although it’s a pretty cool toy to get to the nitty gritty of things.) If you run into a performance problem where you don’t see any obvious physical issue you might have ran into a slow drain device. With the later FOS versions from Brocade there is a counter called er_tx_c3_timeout. This counters shows how many time a frame has been discarded due to upstream credit shortages. If this is an F-port than the device connected to this port is a very candid suspect of mucking up your storage network. If this is an ISL then you will need to look at devices that are more upstream of this port connected to other switches, routers or other equipment.

As always be aware that all these counters are cumulative and will just wrap after a while. You will have to establish a new baseline and then monitor for any counter to increase. The counter I mentioned above is also part of the porterrshow output since FOS version 7 which makes it very easy to determine such a condition.

I hope the blog posts in this series have helped a bit to explain how FC flow control work, how it operates in normal environments and also what might happen if it doesn’t go as planned plus the ways to prevent and solve such conditions.

Let me know if you want to know about this or any other topic and I’ll see what I can produce.

Regards,
Erwin

One rotten apple spoils the bunch – 3

In the previous 2 blog-posts we looked at some areas why a fibre-channel fabric still might have problems even with all redundancy options available and MPIO checking for link failures etc etc.
The challenge is to identify any problematic port and act upon indications that certain problems might be apparent on a link.

So how do we do this in Brocade environments? Brocade has some features build into it’s FOS firmware which allows you to identify certain characteristics of your switches. One of them (Fabric-Watch) I briefly touched upon previously. Two other command which utilize Fabric_Watch are bottleneckmon and portfencing. Lets start with bottleneckmon.

Bottleneckmon was introduced in the FOS code stream to be able to identify 2 different kinds of bottlenecks: latency and congestion.

Latency is caused by a very high load to a device where the device cannot cope with the offered load however it does not exceed the capabilities of a link. As an example lets say that a link has a synchronized speeds of 4G however the load on that link reached no higher than 20MB/s and already the switch is unable to send more frames due to credit shortages. A situation like this will most certainly cause the sort of credit issues we’ve talked about before.

Congestion is when a link is overloaded with frames beyond the capabilities of the physical link. This often occurs on ISL and target ports when too many initiators are mapped on those links. This is often referred to as an oversubscribed fan-in ratio.

A congestion bottleneck is easily identified by looking at the offered load compared to the capability of the link. Very often extending the connection with additional links (ISL, trunk ports, HBA’s)  and spreading the load over other links or localizing/confining the load on the same switch or ASIC will most often help. Latency however is a very different ballgame. You might argue that Brocade also has a portcounter called tim_txcrd_zero  and when that reaches 0 pretty often you also have a latency device but that’s not entirely true. It may also mean that this link is very well utilized and is using all its credits. You should also see a fair link utilization w.r.t. throughput but be aware this also depends on frame size.

So how do we define a link as a high latency bottleneck? The bottleneckmon configuration utility provide a vast amount of parameters which you can use however I would advise to use the default settings as a start by just enabling bottleneck monitoring with the “bottleneckmon –enable” command. Also make sure you configure the alerting with the same command otherwise the monitoring will be passive and you’ll have to check each switch manually.

If a high latency device is caused by physical issues like encoding/decoding errors you will get notified by the bottleneckmon feature however when this happens in the middle of the night you most likely will not be able to act upon the alert in a timely fashion. As I mentioned earlier it is important to isolate this badly behaving device as soon as possible to prevent it from having an adverse effect on the rest of the fabric. The portfencing utility will help with that. You can configure certain thresholds on port-types and errors and if such a threshold has been reached the firmware will disable this port and alert you of it.

I know many administrators are very reluctant to have a switch take these kind of actions on its own and for a long time I agreed with that however seeing the massive devastation and havoc a single device can cause I would STRONGLY advise to turn this feature on. It will save you long hours of troubleshooting with elongated conference calls whilst your storage network is causing your application to come to a halt. I’ve seen it many times and even after pointing to a problem port very often the decision to disable such a port subject to change management politics. I would strongly suggest that if you have such guidelines in your policies NOW is the time to revise those policies and enable the intelligence of the switches to prevent these problem from occurring.

For some comprehensive overview, options and configuration examples I suggest you first take a look at the FOS admins guide of the latest FOS release versions. Brocade have also published some white-papers with more background information.

Regards,
Erwin