Category Archives: Storage Networking

One rotten apple spoils the bunch – 4

Credit – who doesn’t want to have lots of it at the bank

According to Wikipedia the short definition in finance terms is :

Credit is the trust which allows one party to provide resources to another party where that second party does not reimburse the first party immediately (thereby generating a debt, but instead arranges either to repay or return those resources (or other materials of equal value) at a later date


In Fibre Channel it’s not much different. During initialization of a port they both provide the remote party a certain amount of resources (buffer credits) which tell the remote party it is allowed to send this x amount of frames. If this credit is used up the sending port is no longer allowed to send anymore frames. The receiving port get the frame and when the first couple of bytes have been read it will send a so called R_RDY to the sending port telling him to increase his credit by one. This part I described before.

A short side note is that this is normal operation in a class 3 FC network. A class 1 network uses End-to-End credits but this is hardly ever used. 

Taking the above into account it shows that all links in a FC network use this method for flow control. This is thus not only restricted to HBA, Disk, Tape and switchports but also internally within switches this method is used. The most explanatory way of showing this is when you have a blade based chassis where ports in one blade need to transfer frame to a port on another blade. Basically this means that the frame will traverse two more hops before it reaches that port. If you have a small switch with only one ASIC all frames will be short routed in that same ASIC.

As an example.
A Brocade 5100 has a single 40-port Condor2 ASIC which means all 40 front-end ports are connected to this same chip.


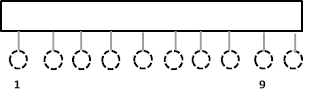
Any frame traversing from port 1 to port 9 will be switched inside that same chip. Sounds obvious. This also means there are only two points of B2B flow control and that is between the devices connected to both port 1 and 9.

When looking at a Brocade 5300 there is completely different architecture.


This switch has 5 GoldenEye2 ASICS which serve 80 front-end ports (16 each) and 4 back-end ASIC which serve as interconnect between those 5 front-end ASICs. Each GoldenEye2 chips has 32 8G ports and each front-end to back-end link is connected with a single 4-port trunk which allows for any-to-any 1:1 subscription ratio.

If we look at this picture and have an HBA connected to port 1 and a storage device connected to port 45 you’ll see that the frame has to traverse 2 additional hops from ASIC 1 to a back-end ASIC and from there onward to ASIC 5. (Internal links are not counted as an official “hop-count” so it is not calculated on fabric parameters.) As you have seen in my previous post when a link error between an end-device and a switch port surfaces causing credit depletion the switch or device will reset the link, bring back the credit count to login values and the upper layer protocol (ie SCSI)  has to retry the IO. There is no such mechanism on back-end ports. You might argue that given the fact this is all inside the switch and no vulnerable components like optical cables can cause corrupt primitives hence lost R_RDY’s are impossible. Unfortunately this is not entirely true. There might be circumstances where front-end problems might propagate to the back-end. This is often seen during very high traffic times and problematic front-end ports. The result is that one or more of those back-end links have a credit stuck at zero which basically means the front-end port is no longer allowed to send frames to the back-end therefore causing similar problems with high latency and elongated IO recovery times. The REALLY bad news is that there is (now : “was”) no recovery possible besides bouncing the entire switch. (By bouncing I mean a reboot and not throwing it on the floor hoping it will return in your hands. Believe me, it wont. At least not in one piece)

All the Brocade OEM’s have run into situations like this with their customers and especially on larger fabrics with multiple blade based chassis with hundreds of ports connected you can imagine this was not a good position to be in.

In order to fix this Brocade has implemented some new logic, albeit proprietary and not FC-FS standard, which allows you to enable a feature to turn on back-end credit checking. In short what it does is that it monitors the number of credits on each of these back-end links, if the credit counter stays at less than the number of credits negotiated during login for the E_D_TOV timeframe and no frames has been sent during that timeframe, the credit recovery feature will reset the link for you in a similar fashion as the front-end port do, and it will resume normal operation.

The way turn on this feature is also part of the bottleneckmon command:

bottleneckmon –cfgcredittools -intport -recover onLrOnly

To be able to use this command you have to be at least at FOS level 6.3.2d, 6.4.2a or higher.
The latest FOS releases also have a manual check in case you might suspect a stuck credit condition.

As soon as you’ve enabled this feature (which I suggest you do immediately) you might run into some new errorcodes in the eventlog. When a lost credit condition is observed you will see a C2-1012 which shows something similar like this:

Message , [C2-1012], ,, WARNING, ,S,P(): Link Timeout on internal portftx= tov= (>)vc_no= crd(s)lost= complete_loss:.  (s)>

If this happens due to a problem on the back-end whereby a physical issue might be the problem the cause is most likely an increased bit error rate causing the same encoding/decoding errors. As shown before this will also corrupt R_RDY primitives. In addition to the C2-1012 you will also see a C2-1006 sometimes followed by a C2-1010

Message , [C2-1006], ,, WARNING, ,S,C: Internal link errors reported, no hardware faultsidentified, continuing monitoring: fault1:, fault2:thresh1:0x.  

Message , [C2-1010], ,, CRITICAL, ,S, C: Internal monitoring has identified suspecthardware, blade may need to be reset or replaced: fault1:,fault2: th2:0x.  

There are some more errorcodes which outline specific conditions but I refer to the Brocade Message Reference guide for more info.

We talked a bit of frameflow and latency in the previous articles. Besides corruption due to a high bit-error rate you might be running into a high latency device which basically is a device which is slow in returning credits. Sometimes this is by design as firmware engineers might use this as a way to throttle incoming traffic which they are unable to offload onto the PCI bus or there is some other problem inside the system itself which causes elongated handling of data by which the HBA cannot send the data quick enough to memory via RDMA or to the CPU for further handling.
Although it is a choice of the firmware and design engineers normally the response time to send back  buffercredits should be virtually instantaneous.

To to give you a feeling of the timing an average R_RDY reponse time is around 1 to 5us. If you have a older network with low performance links this might increase to around 50us or sometimes higher.

Sorry, here should be a picture of a FC trace snippet
FC trace

As you can see (i hope you have good eyesight) the R_RDY is returned within 2us of the dataframe being sent. This includes the reception of the first 24 bytes of the frame and the routing decision time-span the switchport has made. So all in all pretty quick.

On somewhat slower equipment it looks a bit like this:

(The time between the frame and R_RDY shows a delta of 10.5us)

When you have a latency problem where the device is realy slow in returning credits this time is far greater than shown above.

The above picture come from a pretty expensive FC analyser and I don’t expect you to buy one (although it’s a pretty cool toy to get to the nitty gritty of things.) If you run into a performance problem where you don’t see any obvious physical issue you might have ran into a slow drain device. With the later FOS versions from Brocade there is a counter called er_tx_c3_timeout. This counters shows how many time a frame has been discarded due to upstream credit shortages. If this is an F-port than the device connected to this port is a very candid suspect of mucking up your storage network. If this is an ISL then you will need to look at devices that are more upstream of this port connected to other switches, routers or other equipment.

As always be aware that all these counters are cumulative and will just wrap after a while. You will have to establish a new baseline and then monitor for any counter to increase. The counter I mentioned above is also part of the porterrshow output since FOS version 7 which makes it very easy to determine such a condition.

I hope the blog posts in this series have helped a bit to explain how FC flow control work, how it operates in normal environments and also what might happen if it doesn’t go as planned plus the ways to prevent and solve such conditions.

Let me know if you want to know about this or any other topic and I’ll see what I can produce.

Regards,
Erwin

One rotten apple spoils the bunch – 3

In the previous 2 blog-posts we looked at some areas why a fibre-channel fabric still might have problems even with all redundancy options available and MPIO checking for link failures etc etc.
The challenge is to identify any problematic port and act upon indications that certain problems might be apparent on a link.

So how do we do this in Brocade environments? Brocade has some features build into it’s FOS firmware which allows you to identify certain characteristics of your switches. One of them (Fabric-Watch) I briefly touched upon previously. Two other command which utilize Fabric_Watch are bottleneckmon and portfencing. Lets start with bottleneckmon.

Bottleneckmon was introduced in the FOS code stream to be able to identify 2 different kinds of bottlenecks: latency and congestion.

Latency is caused by a very high load to a device where the device cannot cope with the offered load however it does not exceed the capabilities of a link. As an example lets say that a link has a synchronized speeds of 4G however the load on that link reached no higher than 20MB/s and already the switch is unable to send more frames due to credit shortages. A situation like this will most certainly cause the sort of credit issues we’ve talked about before.

Congestion is when a link is overloaded with frames beyond the capabilities of the physical link. This often occurs on ISL and target ports when too many initiators are mapped on those links. This is often referred to as an oversubscribed fan-in ratio.

A congestion bottleneck is easily identified by looking at the offered load compared to the capability of the link. Very often extending the connection with additional links (ISL, trunk ports, HBA’s)  and spreading the load over other links or localizing/confining the load on the same switch or ASIC will most often help. Latency however is a very different ballgame. You might argue that Brocade also has a portcounter called tim_txcrd_zero  and when that reaches 0 pretty often you also have a latency device but that’s not entirely true. It may also mean that this link is very well utilized and is using all its credits. You should also see a fair link utilization w.r.t. throughput but be aware this also depends on frame size.

So how do we define a link as a high latency bottleneck? The bottleneckmon configuration utility provide a vast amount of parameters which you can use however I would advise to use the default settings as a start by just enabling bottleneck monitoring with the “bottleneckmon –enable” command. Also make sure you configure the alerting with the same command otherwise the monitoring will be passive and you’ll have to check each switch manually.

If a high latency device is caused by physical issues like encoding/decoding errors you will get notified by the bottleneckmon feature however when this happens in the middle of the night you most likely will not be able to act upon the alert in a timely fashion. As I mentioned earlier it is important to isolate this badly behaving device as soon as possible to prevent it from having an adverse effect on the rest of the fabric. The portfencing utility will help with that. You can configure certain thresholds on port-types and errors and if such a threshold has been reached the firmware will disable this port and alert you of it.

I know many administrators are very reluctant to have a switch take these kind of actions on its own and for a long time I agreed with that however seeing the massive devastation and havoc a single device can cause I would STRONGLY advise to turn this feature on. It will save you long hours of troubleshooting with elongated conference calls whilst your storage network is causing your application to come to a halt. I’ve seen it many times and even after pointing to a problem port very often the decision to disable such a port subject to change management politics. I would strongly suggest that if you have such guidelines in your policies NOW is the time to revise those policies and enable the intelligence of the switches to prevent these problem from occurring.

For some comprehensive overview, options and configuration examples I suggest you first take a look at the FOS admins guide of the latest FOS release versions. Brocade have also published some white-papers with more background information.

Regards,
Erwin


One rotten apple spoils the bunch – 2

As mentioned in my previous post it only takes a single device to really cause some serious havoc in a storage environment. Now, “Why”, you may ask, do we have all these redundant kit in our environment like dual fabrics, redundant controllers, dual HBA’s , MPIO software etc whilst this “slow drain device” is the absolute “Achilles heel” of the entire storage infrastructure.

Well, lets take a step back why it has come to this point. As with most hardware and software it develops over time so when we started doing network based storage in the early to midst 90’s we started out with a brand new protocol called Fibre-Channel. (I’m sure you heard of it.) This first iteration was based on arbitrated loop basically meaning we connect the TX port of an HBA to a RX port of a disk or tape device and vice versa effectively causing a loop in a P-t-P topology.  When more HBA’s and/or storage devices were inserted you would get a ring topology. This was OK when you had around 3 or 4 devices in a ring (126 were possible) however from a manageability perspective you can imagine this was nightmare. So a new device called a FC-HUB was invented. This at least provided a single connectivity platform so you could run all your cables to the same box. Internally however this was still a loop topology since each hub port just forwarded the frames to the next port which in turn sent it to the device who, if the frame was not addressed to him sent it back to the hub and so on until it reached the destination. Now, this wasn’t really an effective way of doing things so at first the hub got a bit more intelligent by becoming a, so-called, loop switch. This meant the hub port looked at the destination address and if it wasn’t destined for a device attached to his port he would just sent it on to the next hub. This continued until the destination port was reached who then opened the port and sent the frame to the device.

As you can imagine in some larger loop topologies whenever a device came online or off-line every single device in that loop had to be made aware of this change and as such the LIP (Loop Initialization Protocol) was invented. This protocol made sure that each device got a sort of “update” of the appeared or disappeared device. Later on the loop methodology was almost entirely abandoned by switched fabrics who are far more intelligent in shoving frames in the right direction.

Now remember that Fibre-Channel was developed with one thing in mind ans that was to get the maximum possible speed out of very reliable networks. This also meant that no error-correction is done on a protocol layer and ever possible recovery option available was handled by the upper layer protocols like IP or SCSI.
The problem still was that you always has a single point of failure irrespective of which topology you chose. If you had a server in a loop and the HBA had a problem the entire loop could potentially be mucked up. The same when a AL-HUB or FC switch had a problem. All your connections to your disks would be lost and at best you had the luck to use journal-led filesystems who were relatively fast in recovering. How many of you have waited 5 or more hours for a windows chkdsk to finish just to find out it had no problem of the entire disk was corrupted and you had to restore from tape.

So to circumvent that the storage folk more or less determined that you would need at least 2 of everything physically separated so no component could affect the availability of another. This is were MPIO comes in since when you have multiple paths to a device over separate channels the operating system just sees it as a different device so potentially you end up with two disks (or tapes or whatever) which physically it the same volume. MPIO software fixed that by building in logic to present just one volume to the OS. The other thing they build in MPIO was the link error detection. If a link dropped light or lost sync for whatever reason the HBA would go into a non-active state and sends a signal to the upper layer that it had lost the link, MPIO could redirect all IO’s to the other paths and everything would live happily ever after. If that link came back again MPIO would pick this up and provided the option to use that path again and we were on our way.

This shows that MPIO is relying on HBA state signals upon which MPIO can act. The problem however is that a link might drop somewhere else in the fabric.This way the HBA has no problem since its link is still up, in sync and shows no other issues. The only way for MPIO to observe such a problem is to detect an IO failure and react on one or more of these failures by putting the logical path in an offline state. (The physical link from the HBA to the switch is still online.)
This imposes another problem. What if there is no IO going over that path. Many storage networks are designed in an active passive configuration so only one logical path is sending and receiving IO’s. If there is a problem on the passive side of the path but it is further downstream in the fabric the HBA will not notice this and, as such, there will be no notification to the MPIO layer and MPIO will never put this path offline. In case of a real problem on the active side MPIO tries to fail over however it will run into the same problem and both paths to the devices will fail therefore causing the same problem. Many MPIO software vendors like HDLM from Hitachi have build in logic to test for such conditions. In HDLM you configure so called IEM (Intermittent Error Monitoring). HDLM will poll the target device by sending a sector 0 read request every once in a while to the target device and if that succeeds it will wait for the next polling cycle. If an error has been observed more times than the configured threshold it will put the path offline.

You might think we’ve covered everything now and I wish it was true. MPIO only acts upon frames going AWOL but as you’ve seen in my previous article the major problem is often beyond the data frames and a vast majority these days is due to problems in flow control. This in turn causes slow drain device which have an effect of depleting credits further downstream.

Only the FC layer 2 has any notion of buffer credits and this is never propagated to the upper level protocol stack. This is true for any HBA, firmware, driver, MPIO software and OS. If any problems occur downstream of the initiator or upstream of the target, all devices in that particular path will incur a performance impact and an availability problem at some point in time. MPIO will NOT help in this case as I explained above.

The only way to prevent this from happening is active monitoring and management of you entire fabric and if any apparent link issues do surface fix them immediately.

What do you look for in these cases. Basically all errors that might affect an FC frame or FC traffic flow.
In Brocade FOS there is a command called “porterrshow” of which the output looks like this.

The 7 columns outlined show if any issues with frames and/or primitives have been happening at some point in time. (Use the “help porterrshow” command to show an explanation of each of the columns.). Use subsequent porterrshow command to see if any of them are increasing. The other option is to create a new baseline with the “statsclear” commandso all counters are reset to 0.

Cisco has a similar output albeit being a non-table format with the “show interface detailed-counters”.

The next article outlines an option in Brocade FOS to detect a slow drain device with the bottleneckmon feature and how to  automatically disable a port if too many errors of one of the above counters have occurred in a certain time-frame. If you have a Brocade FOS admin manual look at the port-fencing feature.

Kind regards,
Erwin

One rotten apple spoils the bunch – 1

Last week I had another one. A rotten apple that spoiled the bunch or, in storage terms, a slow drain device causing havoc in a fabric.

This time it was a blade-center server with a dubious HBA connection to the blade-center switch which caused link errors and thus corrupt frames, encoding errors and credit depletion. This, being a blade connected to a blade-switch, also propagated the credit depletion back into the overall SAN fabric and thus the entire fabric suffered significantly from this single problem device.

“Now how does this work” you’ll say. Well, it has everything to do with the flow-control methodology used in FC fabrics. In contrast to the Ethernet and TCP/IP world we, the storage guys, expect a device to behave correctly, as gentleman usually do. That being said, as with everything in life, there are always moment in time when nasty things happen and in the case of the “rotten apple” one storage device being an HBA, tape drive, or storage array may be doing nasty things.

Let’s take a look how this normally should work.

FC devices run on a buffer-to-buffer credit model. This means the device reserves an certain amount of buffers on the FC port itself. This amount of buffers is then communicated to the remote device as credits. So basically devices a gives the remote device permission to use X amount of credits. Each credit is around 2112 bytes (A full 2K data payload plus frame header and footer)

The number of credits each device can handle are “negotiated” during fabric login (FLOGI). On the left a snippet from a FLOGI frame were you see the number of credits in hex.

So what happens after the FLOGI. As an example we use a connection that has negotiated 8 credits either way. If the HBA sends a frame (eg. a SCSI read request) it knows it only has 7 credits left. As soon as the switch port receives the frame it has to make a decision where to send this frame to. It does this based on routing tables, zoning configuration and some other rules, and if everything is correct it will route the frame to the next destination. Meanwhile it simultaneously sends back a, so called, R_RDY primitive. This R_RDY tells the HBA that it can increase the credit counter back by one. So if the current credit counter was 5 it can now bump it back up to 6. (A “primitive” lives only between two directly connected ports and as such it will never traverse a switch or router. A frame can, and will, be switched/routed over one or more links)

Below is a very simplistic overview of two ports on a FC link. On the left we have an HBA and on the right we have a switch port. The blue lines represent the data frames and the red lines the R_RDY primitives.

As I said, it’s pretty simplistic. In theory the HBA on the left could send up to 8 frames before it has to wait for an R_RDY to be returned.

So far all looks good but what if the path from the switch back to the device is broken? Either due to a crack in the cable, unclean connectors, broken lasers etc. The first problem we often see is that bits get flipped on a link which in turn causes encoding errors. FC up to 8G uses a 8b10b encoding decoding mechanism. According to this algorithm the normal 8 data bits are converted to a, so called, 10-bit word or transmission character. These 10 bits are the actual ones that travel over the wire. The remote side uses this same algorithm to revert the 10-bits back into the original 8 data bits. This assures bit level integrity and DC balance on a link. However when a link has a problem as described above, chances are that one or more of these 10-bits flip from a 0 to 1 or vice-versa. The recipient detects this problem however since it is unaware of which bit got corrupted it will discard the entire transmission character. This means that if such a corruption is detected it will discard en entire primitive, or, if the corrupted piece was part of a data frame, this entire frame will be dropped.

A primitive (including the R_RDY) consists of 4 words. (4 * 10 bits). The first word is always a control character (K28.5) and it is followed by three data words (Dxx.x). 

0011111010 1010100010 0101010101 0101010101 (-K28.5 +D21.4  D10.2  D10.2 )

I will not go further into this since its beyond the scope of the article.

So if this R_RDY is discarded the HBA does not know that the switch port has indeed free-ed up the buffer and still think it can only send N-1 frames. The below depicts such a scenario:

As you can see when an R_RDY is lost at some point in time it will become 0 meaning the HBA is unable to send any frames. When this happens an error recovery mechanism kicks in which basically resets the link, clearing all buffers on both side of that link and start from scratch. The upper layers of the FC protocol stack (SCSI-FCP, IPFC etc) have to make sure that any outstanding frame have either to be re-transmitted or the entire IO needs to be aborted in which case this IO in it’s entirety needs to be re-executed. As you can see this will cause a problem on this link since a lot of things are going on except actually making sure your data frames are transmitted. If you think this will not have such an impact be aware that the above sequence might run in less than one tenth of a second and thus the credit depletion can be reached within less than a second. So how does this influence the rest of the fabric since this all seems to be pretty confined within the space of this particular link.

Let broaden the scope a bit from an architectural perspective. Below you see a relatively simple, though architecturally often implemented, core-edge fabric.

Each HBA stands for one server (Green, Blue,Red and Orange), each mapped to a port on a storage array.
Now lets say server Red is a slow drain device or has a problem with its direct link to the switch. It is very intermittently returning credits due to the above explained encoding errors or it is very slow in returning credits due to a driver/firmware timing issue. The HBA sends a read request for an IO of 64K data. This means that 32 data frames (normally FC uses a 2K frame size) will be sent back from the array to the Red server. Meanwhile the other 3 servers and the two storage arrays are also sending and receiving data. If the number of credits negotiated between the HBA’s and the servers is 8 you can see that after the first 16K of that 64K request will be send to Red server however the remaining 48K still is either in transit from the array to the HBA or it is still in some outbound queue in the array. Since the edge switch (on the left) is unable to send frames to the Red server the remaining data frames (from ALL SERVERS) will stack up on the incoming ISL port (bright red). This in turn causes the outbound ISL port on the core switch (the one on the right) to deplete its credits which means that at some point in time no frames are able to traverse the ISL therefore causing most traffic to come to a standstill.

You’ll probably ask “So how do we recover from this?”. Well, basically the port on the edge switch to the Red server will send a LR (Link Reset) after the agreed “hold-time”. The hold time is a calculated period in which the switch will hold frames in its buffers. In most fabrics this is 500ms. So if the switch has had zero credit available during the entire hold period and it has had at least 1 frame in its output buffer it will send a LR to the HBA. This causes both the switch and HBA buffer to clear and the number of credits will return to the value that was negotiated during FLOGI.

If you don’t fix the underlying problem this process will go on forever and, as you’ve seen, will severely impact your entire storage environment.

“OK, so the problem is clear, how do I fix it?”

There are two ways to tackle the problem, the good and the bad way.

The good way is to monitor and manage your fabrics and link for such a behavior. If you see any error counter increasing verify all connections, cables, sfp’s, patch-panels and other hardware sitting in between the two devices. Clean connectors, replace cables and make sure these hardware problems do not re-surface again. My advice is if you see any link behaving like this DISABLE IT IMMEDIATELY !!!! No questions asked.

The bad way is to stick your head in the sand and hope for it go away. I’ve seen many of such issues crippling entire fabrics and due strictly enforced change control severe outages occurred and elongated recovery (very often multiple days) was needed to get things back to normal again. Make sure you implement emergency procedures which allow you to bypass these operational guidelines. It will save you a lot of problems.

Regards,
Erwin van Londen

Brocade vs Cisco. The dance around DataCentre networking

When looking at the network market there is one clear leader and that is Cisco. Their products are ubiquitous from home computing to enterprise Of course there are others like Juniper, Nortel, Ericson but these companies only scratch the surface of what Cisco can provide. These companies rely on very specific differentiators and, given the fact they are still around, do a pretty good job at it.

A few years ago there was another network provider called Foundry and they had some really impressive products and I that’s mainly why these are only found in the core of data-centres which push a tremendous amount of data. The likes of ISP’s or  Internet Exchanges are a good fit. It is because of this reason Brocade acquired Foundry in July 2008. A second reason was that because Cisco had entered the storage market with the MDS platform. This gave Brocade no counterweight in the networking space to provide customers with an alternative.

When you look at the storage market it is the other way around. Brocade has been in the Fibre Channel space since day one. They led the way with their 1600 switches and have outperformed and out-smarted every other FC equipment provider on the planet. Many companies that have been in the FC space have either gone broke of have been swallowed by others. Names like Gadzoox, McData, CNT, Creekpath, Inrange and others have all vanished and their technologies either no longer exist or have been absorbed into products of vendors who acquired them.

With two distinct different technologies (networking & storage) both Cisco and Brocade have attained a huge market-share in their respective speciality. Since storage and networking are two very different beasts this has served many companies very well and no collision between the two technologies happened. (That is until FCoE came around; you can read my other blog posts on my opinion on FCoE).

Since Cisco, being bold, brave and sitting on a huge pile of cash, decided to also enter the storage market Brocade felt it’s market-share declining. It had to do something and thus Foundry was on the target list.

After the acquisition Brocade embarked on a path to get the product lines aligned to each other and they succeeded with  their own proprietary technology called VCS (I suggest you search for this on the web, many articles have been written). Basically what they’ve done with VCS is create an underlying technology which allows a flat level 2 Ethernet network operate on a flat fabric-based one which they have experiences with since the beginning of time (storage networking that is for them). 

Cisco wanted to have something different and came up with the technology merging enabled called FCoE. Cisco uses this extensively around their product set and is the primary internal communications protocol in their UCS platform. Although I don’t have any indicators yet it might well be that because FCoE will be ubiquitous in all of Cisco’s products the MDS platform might be abolished pretty soon from a sales perspective and the Nexus platforms will provide the overall merged storage and networking solution for Cisco data centre products which in the end makes good sense.

So what is my view on the Brocade vs. Cisco discussion. Well, basically, I do like them both. As they have different viewpoints of storage and networking there is not really a good vs bad. I see Brocade as the cowboy company providing bleeding edge, up to the latest standards, technologies like Ethernet fabrics and 16G fibre channel etc whereas Cisco is a bit more conservative which improves on stability and maturity. What the pros and cons for customers are I cannot determine since the requirement are mostly different.

From a support perspective on the technology side I think Cisco has a slight edge over Brocade since many of the hardware and software problems have been resolved over a longer period of time and, by nature, for Brocade providing bleeding edge technology with a “first-to-market” strategy may sometimes run into a bumpy ride. That being said since Cisco is a very structured company they sometimes lack a bit of flexibility and Brocade has an edge on that point.

If you ask me directly which vendor to choose when deciding a product set or vendor for a new data centre I have no preference. From a technology standpoint I would still separate fibre-channel from Ethernet and wait until both FCoE and Ethernet fabrics have matured and are well past their “hype-cycle”. We’re talking data centres here and it is your data. Not Cisco’s and not Brocade’s. Both FC and Ethernet are very mature and have a very long track-record of operations, flexibility and stability. The excellent knowledge there is available on each of these specific technologies gives me more piece of mind than the outlook of having to deal with problems bringing the entire data centre to a standstill.

Erwin

Brocade Fabric Watch – The most underutilised feature

Many customer cases I handle are related to poor connectivity. A connectivity problem can be caused by unclean connectors, broken cables or SFP’s. (See one of my earlier blog posts).
Although the switches are capable or identifying physical issues and subsequently notifying administrators, it’s  hardly ever being followed up. Very often an acute issue is lingering for days before an administrator starts investigating and in many cases this is only because of a server admin start complaining of SCSI errors or IO time-outs or very poor performance.
So how do we prevent this from happening? Well, for starters make sure that your environment is clean. With this I mean you should make sure that all connectors are not exposed to dust or other types of contamination. Secondly try to handle cables with care. I’ve seen many cases where cables were under so much tension that Jimmy Hendrix would be able to compose one of his finest works on it. Although modern fibre cables are fairly rugged and are able to handle a fair amount of tension try not to test this. At a last bullet point I would suggest to keep an eye out on light emitting power ratios. As you most likely know lasers do not have an infinite lifetime and their transmission power will decrease over time. At some point in time the receiving end of a link is most likely no longer able to distinguish between on or off in a reliable manner and as such the 8b10b (or 64b/66b) encoding/decoding algorithm will start to detect bit flips and as such it will discard a transmission word. The upper and lower power requirements are published in the data-sheets so as soon as one of these values reach their lower values replace them.

Now you might argue that if you have 10000 ports in your fabric you might have other things to worry about than checking SFP power values every day. The stress put on storage admins is not decreasing the last time I looked so this will most likely not be the case for the years to come.

Fortunately you don’t have to. Both Brocade and Cisco provide option to monitor each individual component. For many years Brocade has one of the best embedded management tools there is namely Fabric Watch (FW). FW is not an active management tool per-se however the underlying goal is to have a sort of self-healing and protecting framework to monitor, alert and take action on events that might have implications on overall fabric behaviour.

A single dodgy link can have significant implications on overall fabric behaviour which can, and will, impact many hosts depending on topology and traffic pattern. FW allows you to set thresholds on many items in a switch from SFP power values, link errors, temperature readings etc etc. Each of these items can be configured with certain characteristics like above,below,in-between or change values. On each of these a time frame can be configured.

Now lets take an example on a link that has some intermittent errors. Your applications tolerate a certain error ratio per time-frame that they can recover from so in case on or two IO errors per hour are seen by the OS or application it will re-send the read or write command and all is good. If however, this starts to increase you might end up with the application going down or even data corruption. If you have configured FW to send a notification in case the amount of errors increase beyond the application tolerance, you will be able to take some action and investigate were the problem might be.

Now there is another issue and that is that you’re most likely not sitting behind a console 24×7 or monitoring emails during your holidays. So even if you do get notified there is a good chance you will not notice it. (I know I won’t when I’m playing golf :-))
These call for some more drastic measures and this is also covered by FW. If a certain threshold increases beyond a warning level and reaches a critical level FW allows you to take some action right away. This is a feature Brocade call port-fencing. Basically what it means is that this threshold is met it will just disable the port to prevent it from propagating the problems further up in the fabric. This is REALLY an area you SHOULD investigate. It can save you from having many issues showing up all over the fabric.

The title of this blog post is unfortunately the status as it now stands with most of the installed base of fabrics and the reason seems to be that administrators have a problem with software deciding on disruptive actions like disabling ports. My argument is that this port is already in a degraded state plus it also causes other links in the entire fabric having problems. If you don’t know what your looking for and have this large 10000 port fabric it will take you a significant amount of time before you know what’s going on. In this time many, many more hosts and applications can and will suffer from significant performance and other problems which might create some significant overtime for many people.

Regards,
Erwin

Fill Words. What are those, what do they do and why are they needed

There has been quite some confusion around the use of fill words with the adoption of the 8G fibre-channel standard. Some admins have reported that they have problems connecting devices on this speed as well as numerous headaches in long-distance replication especially when DWDM/CWDM equipment is involved.

An ordered set is a transmission word used to perform control and signaling functions. There are 3 types of ordered sets defined:

1. Frame delimiters. These identify the start and end of frames.
2. Primitive signals. These are normally used to indicate events or actions (like IDLE)
3. Primitive Sequences which are used to indicate state or condition changes and are normally transmitted continuously until something causes the current state to chance. Examples are NOS,OLS,LR,LRR

So what is a fill-word? A fill-word is a primitive signal which is needed to maintain bit and word synchronization between two adjacent ports. Is doesn’t matter what port type (F-port,E-port,N-Port etc) it is. They are not data frames in the sense that they transport user-data but instead they communicate status messages between these two ports. If no user-data is transmitted the ports will send so called IDLE frames. These are just frames with some bit pattern where the ports are able to keep there synchronization on a bit-level as well as a word level. The IDLE primitive is a 10-bit transmission character on the wire, as any ordered set starts with K28.5 which is a fibre-channel notation for 8B10B encoding and three data words of which the last 20 bits are 1010101010….etc. Depending on the content of these transmission characters it’s either a fill-word or non-fillword.

Examples of fillwords are IDLE, ARB(F0), ARB(FF) and non-fillword are R_RDY, VC_RDY etc.

So what happened recently with the introduction of the 8G standard.

In the 1,2 and 4G standard the IDLE primitive signal was used to keep bit and word synchronization. This bitpattern was OK on those speeds however it has been observed that when increasing the clock speed this pattern caused high emissions which in turn could cause problems on adjacent ports and links. In order to reduce that the standard now requires links that are using 8G speed to use the ARB(ff) fill-word. This is a different bit-pattern which doesn’t have this high emission characteristic.

You might wonder what does this have to do with my connection problem? If links negotiate on 8G speed they both have to use the ARB(FF) fill-word. If that doesn’t happen for some reason then the ports cannot maintain word synchronisation and therefore cannot change the port into the active state. This causes both ports to be in some sort of deadlock situation and although you may see that there is a green status light on your HBA and switch port it still is not able to transfer data.

The standard defines that ports who connect on 8G speed first have to initialize with IDLE fill-words and as soon as the port changes to the active state it should change the fill-word to ARB(FF).

It becomes even more complicated with DWDM and CWDM equipment particularly when multiplexers are used. These TDM devices normally crack open the fibre-channel link on a frame boundary level and then are able to multiplex this on a higher clock-rate so they are able to send data from multiple links into one wavelength. If however these TDM devices cannot open the fibre-channel link because they only look for IDLE fillwords then the end-to-end link will fail.

Verify with you manufacturer if you use TDM devices and if so do they support ARB(FF) fillwords. If not than you may have to force the linkspeed to a lower level like 4G.

The importance of clean fibre optics

I attended Cisco Live this week in Melbourne. Since it was very close to home and Cisco was kind enough to provide me with an entry ticket. (Many thanks for this.)

While strolling around the expo floor I ran into the nice people from Fluke Networks who were showing their testing equipment and of course I was very interested in the optical side of the fence. (I haven’t seen wireless storage networks yet so I’ll save that part of their impressive toolkit for later. :-)).

Since I’m doing troubleshooting as a day to day job I see many issues which have characteristics of a physical nature. This can be a bad cable, patch panel, SFP or anything in that nature.

Just when I wanted to start this blog post I saw that my Melbournian buddy  Anthony Vandewerdt just beat me to it and wrote the article “Semmelweiss could see the problem” in which he described the problem of unclean cables and where it might lead to.  (read this first and then come back here.)

In order to complement that article I’ll try to explain why this is so important.

I’m pretty sure that everyone these days know that computers work with bits which are either a 1 or 0. To be able to communicate with other computers (or devices in general) we use transmission of bits with either an on or off signal whether this being an electrical current or an optical wave. Electrical use has the nasty habit that the energy is partially stored in the capacitance of the electrical cable so it has a certain drop zone before it becomes a capacitor with 0 value. You can see this very well if you use a laptop charger with a small led. When you unplug it from the wall-socket it takes a couple of seconds before the current is completely gone from the capacitors in the transformer. This is also one of the primary reasons FC uses a 8b/10b encoding decoding schema to keep a balanced DC value.

The optical to electrical transformers have the same issue albeit not being in the cable itself but more in the physics characteristics of the circuitry. There is a certain fall-off and ramp-up time before current becomes completely zero and completely one respectively. This is very important since this depicts when a receiver should determine if the incoming bit should be seen as a 1 or are 0.

The optics people and companies represented in IEEE and T11-2 do write up the official metrics so this is all being done for you. There is nothing on a switch, array or other network equipment where you can tune this.

The measurement and characteristics of a signal can be measured with an oscillator. The result you see looks like this:

 
The blue lines show the voltage on the oscillator and this shows the, so called, eye-pattern. The hexagon in the middle is determine by the folks of IEEE and T11-2 and can be loaded as a software feature for ease of use on most equipment. (Note: be aware that this differs per technology and optical characteristic like FC, Ethernet, DWDM etc. )
 
The above picture shows a perfect eye-pattern since it show that the ramp-up time (from the bottom blue line to the top) is way before the “decision point” on becoming a 1 and the fall-off time is way after the decision point of becoming a 0.
 
“So what does this have to do with my fibre-cable” you may ask.
When connectors are not clean the light may be reflected back in to the cable causing jitter. It is this jitter that can significantly close the eye-pattern to a point where the receiver can no longer determine if an incoming light should be determined as a 1 or 0. The below picture show that this comes pretty close.


By default it will keep the same value it had on the previous clock cycle. This means that a one remains a 1 even though it actually should have been a 0 and vice versa. The result will be that the bitstream from the receiver buffer into the serdes chip will be incorrect thereby causing a decoding error. For FC it means that the er_enc_out or er_enc_in value on the LESB (Link Error Status Block) is incremented by one (depending if the 10-bit transmission word was part of a FC frame or not). On a Brocade switch in the porterrshow output this is shown in the enc_in or enc_out column.
 
If this happens on a bit which was part of a, normally valid, FC frame the frame now contains an invalid byte. If we not would have a fall-back mechanism this would have led to an invalid byte being send to the operating system and application causing corruption and even system failures. Since we also do a CRC check on the entire frame the destination port will discard it entirely and the upper layer SCSI stack (or whatever protocol resides on the FC4 layer) retry the IO.
 
The problem is that with distance you get loss of power (remember that light is measured in db’s). Depending on the type of cable (OM1,2,3,4) this budget loss on the cable is fixed. Every connection or splice (two optical cables welded together) adds to the link loss and decreases the optical power received on the other side of the link. The problem with dirty connections is that it significantly decreases the optical power which can cause the problem that the value in db the receiver can detect falls outside the specification of that particular SFP. This can cause link losses and port flapping causing all sorts of other nasty issues.
 
The link loss budget can be calculated based on the launch power of the transmitter, the number of connectors and splices in the cable-plant plus the margin on the receiver side.If this all falls below the receiver sensitivity mark the receiver will drop the link and the ports will go offline.


On a Brocade switch you can see the transmitter and receiver value with the “sfpshow” command:
 
 
The specifications of the SFP determine what the transmit and receive power should be. If the actual values of the RX power fall outside the specification of the SFP you should start to look at you cable’s, connectors and start cleaning them. If this doesn’t help there might be another problem like a crack in the cable or the SFP has a broken laser. In this case either replace the cable and/or SFP.
 
Hope this may help to explain why you might see strange things in your fibre channel network if the connectors are not clean and your support organisation is really stressing to fix and maintain your cable plant. I did mention I work in support and I see many connectivity issues resulting in flapping ports, overall performance issues and even data-loss or corruption.
 
If you want to know the characteristics of optical cables or SFP’s I suggest you have a look at the JDSU, Finisar or Avago websites. Also check out the FOA Youtube channel who uploaded some nice video’s which explain in detail the ins and outs of fibre optics.
Regards,
Erwin

Help, my Thin Provisioning is not working

On many occasions I’ve seen posts from storage administrator who mapped some luns to hosts and on the first use the entire pool got whacked with all bells and whistles going off. (Yes, we can control bells and whistles.:-))


The administrator did nothing wrong however he should have communicated with the server admin what the luns were for and how they were going to be used. As I mentioned in my previous post around Thin Provisioning is that the array doesn’t really know what’s going on from a host perspective. It know, due to HMO (port group settings) which type of host is connected and adjusts some internal knobs to accommodate for the commands from that particular host or application.
What it does not know is how that application is using the array.

Remember that a storage array just knows about reads and writes (besides the special commands specific for management).

In normal occasions a lun is mapped and on the host this lun is then formatted to a specific filesystem. Some filesystems use only the first couple of sectors of a disk to outline mapping of the blocks so if the application want to write a chuck of data the filesystem creates the inode, registers the mapping in the filesystem table in the beginning of the disk and away we go.

When we look at the disk from this perspective when formatted it looks like this:

————————————————————————————
|************   |            |               |             |            |
————————————————————————————

Only the first sector is written and the rest is still empty.

The same would happen if this lun was mapped out of a thin provisioned pool. Only the first couple of sectors on the virtual disk would be written, and therefore only the page occupying these sectors, would be marked as used in the pool, and the rest would still be empty and thus the array would not allocate them to this particular lun.

So far all is well.

The problem begins when the same lun is formatted with a filesystem which does interleaved formatting. The concept here is that the filesystem mapping table is spread over the entire disk which might improve performance if you do this on a single physical disk.

————————————————————————————

|**          | **           | **           | **            | **           | **
————————————————————————————

On writes the chances that you’re able to update the mapping table, create the inodes and write the data in one stroke is fairly good.

Now compare the interleaved method to the one I described before and you will be able to figure out why this is really rendering This Provisioning useless. Since the chance is near 100% that all pages from that pool will be “touched” at least once, the entire page will be marked as used in that pool even though the net written data is next to nothing.

No you might think: “OK, I choose a filesystem which is TP friendly and I’m sorted”.

Well, not quite. Server administrator very often like to have their own “storage management tool” in the likes of volume managers. This allows them to virtualise  “physical” luns mapped out of an array to a single entity in their systems.
The problem with this is that it will behave the same as the TP unfriendly filesystem with that difference that it’s not the filesystems doing the interleaving of metadata but now it’s the volumemanagers doing the same thing.

In both cases a TP pool will fill up pretty quickly without having an application write a single bit.

All storage vendors have whitepapers and instructions available how to plan for all these occasions. If you don’t want to run into surprises I suggest you have a look at them.

Regards,
Erwin van Londen

SCSI UNMAP and performance implications

When listening to Greg Knieriemens’ podcast on Nekkid Tech there was some debate on VMWare’s decisision to disable the SCSI UNMAP command on vSphere 5.something. Chris Evans (www.thestoragearchitect.com) had some questions why this has happened so I’ll try to give a short description.

Be aware that, although I work for Hitachi, I have no insight in the internal algorithms of any vendor but the T10 (INCITS) specifications are public and every vendor has to adhere to these specs so here we go.

With the introduction of thin provisioning in the SBC3 specs a whole new can of options, features and functions came out of the T10 (SCSI) committee which enabled applications and operating systems to do all sorts of nifty stuff on storage arrays. Basically it meant you could give a host a 2 TB volume whilst in the background you only had 1TB physically available. The assumption with thin provisioning (TP) is that a host or application wont use that 2 TB in one go anyway so why pre-allocate it.

So what happens is that the storage array will provide the host with a range of addressable LBA’s (Logical Block Addresses) which the host is able to use to store data. In the back-end on the array these LBA’s are then only allocated upon actual use. The array has one or more , so called, disk pools where it can physically store the data. The mapping from the “virtual addressable LBA” which the host sees and the back-end physical storage is done by mapping tables. Depending on the implementation between the different vendor certain “chunks” out of these pools are reserved as soon as one LBA is allocated. This prevents performance bottlenecks from a housekeeping perspective since it doesn’t need to manage each single LBA mapping. Each vendor has different page/chunks/segment sizes and different algorithms to manage these but the overall method of TP stay the same.

So lets say the segment size on an array is 42MB (:-)) and an application is writing to an LBA which falls into this chunk. The array updates the mapping tables, allocates cache-slots and all the other housekeeping stuff that is done when a write IO is coming in.  As of that moment the entire 42 MB is than allocated to that particular LUN which is presented to that host. Any subsequent write to any LBA which falls into this 42MB segment is just a regular IO from an array perspective. No additional overhead is needed or generated w.r.t. TP maintenance. As you can see this is a very effective way of maintaining an optimum capacity usage ratio but as with everything there are some things you have to consider as well like over provisioning and its ramifications when things go wrong.

Lets assume that is all under control and move on.

Now what happens if data is no longer needed or deleted. Lets assume a user deletes a file which is 200MB big (video for example) In theory this file had occupied at least 5 TP segments of 42MB. But since many filesystems are very IO savvy they do not scrub the entire 42MB back to zero but just delete the FS entry pointer and remove the inodes from the inode table. This means that only a couple of bytes effectively have been removed on the physical disk and array cache.
The array has no way of knowing that these couple of bytes, which have been returned to 0, represent an entire 200MB file and as such these bytes are still allocated in cache, on disk and the TP mapping table. This also means that these TP segments can never be re-mapped to other LUN’s for more effective use if needed. To overcome this there have been some solutions to overcome this like host-based scrubbing (putting all bits back to 0), de-fragmentation to re-align all used LBA’s and scrub the rest and some array base solutions to check if segments do contain on zero’s and if so remove them from the mapping table and therefore make the available for re-use.

As you can imagine this is not a very effective way of using TP. You can be busy clearing things up on a fairly regular basis so there had to be another solution.

So the T10 friends came up with two new things namely “write same” and “unmap”. Write same does exactly what it says. It issues a write command to a certain LBA and tells the array to also write this bit stream to a certain set of LBA’s. The array then executes this therefore offloading the host from keeping track of all the write commands so it can do more useful stuff than pushing bits back and forth between himself and the array. This can be very useful if you need to deploy a lot of VM’s which by definition have a very similar (if not exactly) the same pattern. The other way around it has a similar benefit that if you need to delete VM’s (or just one) the hypervisor can instruct the array to clear all LBA’s associated with that particular VM and if the UNMAP command is used in conjunction with the write same command you basically end up with the situation you want. The UNMAP command instructs the array that a certain LBA (LBA’s) are no longer in use by this host and therefore can be re-used in the free pool.

As you can imagine if you just use the UNMAP command this is very fast from a host perspective and the array can handle this very quickly but here comes the catch. If the host instructs the array to UNMAP the association between the LBA and the LUN it is basically only a pointer from the mapping table that is removed. the actual data does still exist either in cache or on disk. If that same segment is then re-allocated to another host in theory this particular host can issue a read command to any given LBA in that segment and retrieve the data that was previously written by the other system. Not only can this confuse the operating system but it also implies a huge security risk.

In order to prevent this the array has one or more background threads to clear out these segments before they are effectively returned to the pool for re-use. These tasks normally run on a pretty low priority to not interfere with normal host IO. (Remember that it still is (or are) the same CPU(s) who have to take care of this.) If CPU’s are fast and the background threads are smart enough under normal circumstances you hardly see any difference in performance.

As with all instruction based processing the work has to be done either way, being it the array or the host. So if there is a huge amount of demand where hypervisors move around a lot of VM’s between LUN’s and/or arrays, there will be a lot of deallocation (UNMAP), clearance (WRITE SAME) and re-allocation of these segments going on. It depends on the scheduling algorithm at what point the array will decide to reschedule the background and frontend processes so that the will be a delay in the status response to the host. On the host it looks like a performance issue but in essence what you have done is overloading the array with too many commands which normally (without thin provisioning) has to be done by the host itself.

You can debate if using a larger or smaller segment size will be beneficial but that doesn’t matter at all. If you use a smaller segment size the CPU has much more overhead in managing mapping tables whereas using bigger segment sizes the array needs to scrub more space on deallocation.

So this is the reason why VMWare had disabled the UNMAP command in this patch since a lot of “performance problems” were seen across the world when this feature was enabled. Given the fact that it was VMWare that disabled this you can imagine that multiple arrays from multiple vendors might be impacted in some sense otherwise they would have been more specific on array vendors and types which they haven’t done.